Bizzdesign Unify: An AI-native platform for faster, better transformation decisions.
Technical Capabilities for Business Success

Imagine a world where businesses operate like finely-tuned symphonies, each department harmoniously performing its part to create beautiful music. Now, picture the conductor of this grand orchestra as modern technology, orchestrating seamless operations and driving innovation.
This is our world today, driven by ever-evolving technical capabilities. From artificial intelligence that predicts customer behavior to blockchain technology ensuring secure transactions, the marvels of modern tech are reshaping industries and daily life.
But what exactly are these technical capabilities that everyone keeps buzzing about? More importantly, how do they influence our everyday experiences and future opportunities?
Whether you're a tech enthusiast curious about the latest innovations or someone just looking to understand how all these advancements impact your world, this article will explain them.
What are Technical Capabilities, and Why are They Important for Businesses?
Technical capability refers to an organization's ability to perform specific technical functions or tasks, typically related to IT infrastructure, systems, software, and other technology-based functions.
This capability often includes technical skills, tools, frameworks, and expertise within a company’s IT and engineering departments, enabling the development, deployment, maintenance, and scaling of technology solutions.
Role of technical capabilities in digital transformation
Think of technical capabilities in digital transformation as the beating heart of a thriving digital ecosystem. They enable businesses to harness advanced tools, from AI-driven analytics to seamless cloud integrations, shaping an agile and responsive environment. Imagine you’re driving a high-tech race car; without a powerful engine and sophisticated control system, cutting-edge design is merely ornamental.
Now, consider how these capabilities unlock potential across various sectors. For instance, in healthcare, precision diagnostics rely on data interoperability and machine learning algorithms—a dynamic blend only possible through robust tech frameworks. Whether it's predictive maintenance in manufacturing or personalized experiences in retail, the magic lies not just in having technology but in wielding it with finesse.
Technical Capabilities vs Business Capabilities
Technical Capability | Business Capability | |
Purpose | Supports technology-driven goals and functions within the organization. | Enables core business functions to achieve strategic goals. |
Scope | Focuses on specific technical skills, systems, and infrastructures. | Encompasses broad business activities that contribute to competitive advantage. |
Role in Organization | Often centered in IT, engineering, and tech-focused departments. | Spans across departments such as operations, finance, marketing, and human resources. |
Impact on Strategy | Enhances operational efficiency, innovation, and technical resilience. | Aligns business processes with long-term strategic objectives and customer needs. |
Dependency | Serves as a foundation that enables or enhances business capabilities (e.g., IT supporting CRM). | Defines requirements for technical capabilities to support specific business outcomes. |
Examples | Coding skills, network security, data analytics, and cloud infrastructure. | Product development, customer service, supply chain management, and financial planning. |
Technical capabilities often support or enable business capabilities. For example, a business capability like customer relationship management (CRM) may require technical capabilities in data analytics and database management to operate effectively. Conversely, the business strategy will guide the development of technical capabilities, ensuring technology investments align with desired business outcomes.
Technical Capabilities in Different Industries
The relevance of technical capabilities varies across industries, each with its unique demands and applications of technology. Understanding how these capabilities are utilized in different sectors can provide valuable insights into their importance.
In manufacturing, technical capabilities have revolutionized production processes. The integration of robotics, automation, and data analytics has led to the creation of smart factories, where efficiency and precision are significantly enhanced. Engineers and technicians in this field must possess a strong understanding of these technologies to maintain and optimize production lines.
The healthcare industry is another sector where technical capabilities are vital. With the rise of telemedicine, electronic health records, and medical imaging technologies, healthcare professionals must be equipped with the necessary technical skills to operate and interpret these systems. Moreover, the advent of personalized medicine, driven by data analytics and genomics, further underscores the need for advanced technical capabilities in this field.
In the finance sector, the rapid adoption of fintech solutions has transformed the way financial services are delivered. From blockchain technology to algorithmic trading, technical capabilities are essential for developing and maintaining the platforms that underpin modern finance. Professionals in this industry must be proficient in coding, data analysis, and cybersecurity to ensure the security and efficiency of financial transactions.
Education is another domain where technical capabilities are becoming increasingly important. The rise of e-learning platforms, educational apps, and virtual classrooms has created a demand for educators who are not only knowledgeable in their subject areas but also adept at using technology to enhance the learning experience. Technical capabilities in this sector include proficiency in educational software, digital content creation, and online communication tools.
Core Technical Skills and Their Significance
At the heart of technical capabilities lie the core technical skills that serve as the foundation for more advanced competencies. These skills are indispensable in virtually every technology-related role and form the basis for specialization in various tech domains.
Software development is one of the most sought-after core technical skills. It involves writing, testing, and maintaining code that powers applications, websites, and software systems. Proficiency in programming languages such as Python, Java, and C++ is essential for software developers, as is an understanding of software development methodologies like Agile and DevOps.
Networking is another critical core technical skill. With the growing reliance on connected devices and cloud-based services, network engineers are responsible for designing, implementing, and managing networks that ensure seamless communication between devices. This requires a deep understanding of network protocols, routing, switching, and network security.
Cybersecurity is an increasingly important core technical skill, given the rising number of cyber threats. Cybersecurity professionals must be skilled in identifying vulnerabilities, implementing security measures, and responding to incidents. Knowledge of encryption, firewalls, and intrusion detection systems is crucial in this field.
Understanding the Scope of Technical Capabilities
Technical capabilities encompass a broad range of skills and proficiencies that are crucial in the modern workforce. These capabilities can be categorized into core technical skills, advanced technological proficiencies, and soft skills that complement the technical expertise.
Core technical skills are the foundational abilities required to perform essential tasks in technology. These include knowledge of programming languages, software development practices, networking, and cybersecurity. For instance, a software developer must be proficient in languages like Python, Java, or C++, while a network engineer needs to understand the intricacies of network protocols and infrastructure.
Advanced technological proficiencies go beyond the basics, involving expertise in cutting-edge technologies such as artificial intelligence, machine learning, cloud computing, and the Internet of Things (IoT). Professionals with these capabilities are in high demand as they can implement complex solutions that drive innovation and efficiency within organizations.
| However, technical capabilities aren't limited to just hard skills. Soft skills, such as problem-solving, communication, and adaptability, play a crucial role in complementing technical expertise. |
Technical Capabilities in Different Industries
The relevance of technical capabilities varies across industries, each with its unique demands and applications of technology. Understanding how these capabilities are utilized in different sectors can provide valuable insights into their importance.
In manufacturing, technical capabilities have revolutionized production processes. The integration of robotics, automation, and data analytics has led to the creation of smart factories, where efficiency and precision are significantly enhanced. Engineers and technicians in this field must possess a strong understanding of these technologies to maintain and optimize production lines.
The healthcare industry is another sector where technical capabilities are vital. With the rise of telemedicine, electronic health records, and medical imaging technologies, healthcare professionals must be equipped with the necessary technical skills to operate and interpret these systems. Moreover, the advent of personalized medicine, driven by data analytics and genomics, further underscores the need for advanced technical capabilities in this field.
In the finance sector, the rapid adoption of fintech solutions has transformed the way financial services are delivered. From blockchain technology to algorithmic trading, technical capabilities are essential for developing and maintaining the platforms that underpin modern finance. Professionals in this industry must be proficient in coding, data analysis, and cybersecurity to ensure the security and efficiency of financial transactions.
Education is another domain where technical capabilities are becoming increasingly important. The rise of e-learning platforms, educational apps, and virtual classrooms has created a demand for educators who are not only knowledgeable in their subject areas but also adept at using technology to enhance the learning experience. Technical capabilities in this sector include proficiency in educational software, digital content creation, and online communication tools.
Core Technical Skills and Their Significance
At the heart of technical capabilities lie the core technical skills that serve as the foundation for more advanced competencies. These skills are indispensable in virtually every technology-related role and form the basis for specialization in various tech domains.
Software development is one of the most sought-after core technical skills. It involves writing, testing, and maintaining code that powers applications, websites, and software systems. Proficiency in programming languages such as Python, Java, and C++ is essential for software developers, as is an understanding of software development methodologies like Agile and DevOps.
Networking is another critical core technical skill. With the growing reliance on connected devices and cloud-based services, network engineers are responsible for designing, implementing, and managing networks that ensure seamless communication between devices. This requires a deep understanding of network protocols, routing, switching, and network security.
Cybersecurity is an increasingly important core technical skill, given the rising number of cyber threats. Cybersecurity professionals must be skilled in identifying vulnerabilities, implementing security measures, and responding to incidents. Knowledge of encryption, firewalls, and intrusion detection systems is crucial in this field.
The Role of Advanced Technology in Expanding Capabilities
As technology continues to evolve, so too do the technical capabilities required to harness its potential. Advanced technologies such as artificial intelligence (AI), cloud computing, and the Internet of Things (IoT) are expanding the scope of technical capabilities, creating new opportunities and challenges for professionals and organizations alike.
Artificial intelligence (AI) is a prime example of how advanced technology is reshaping technical capabilities. AI has the potential to revolutionize industries by automating complex tasks, analyzing vast amounts of data, and making intelligent decisions. Professionals with expertise in AI and machine learning are in high demand as organizations seek to leverage these technologies to gain a competitive edge.
Cloud computing is another transformative technology that has expanded technical capabilities. The ability to store and process data on remote servers has revolutionized the way businesses operate, enabling greater flexibility, scalability, and cost efficiency. Cloud engineers and architects must be proficient in cloud platforms such as AWS, Azure, and Google Cloud, as well as in cloud security and data management.
The Internet of Things (IoT) is also driving the expansion of technical capabilities. IoT refers to the network of connected devices that collect and exchange data, enabling new applications and services in areas such as smart homes, industrial automation, and healthcare. Professionals in this field must possess a deep understanding of IoT protocols, device management, and data analytics.
Benefits of integrating technical capabilities into business strategies
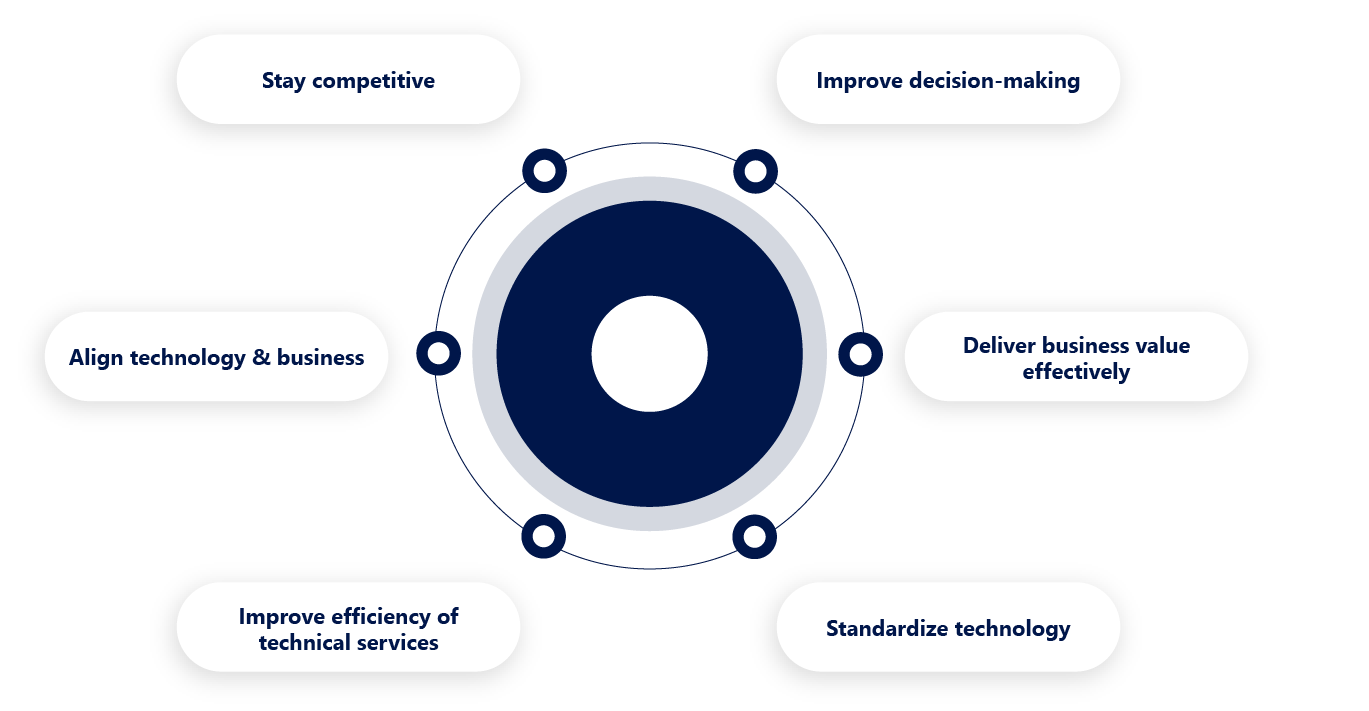
Benefits of integrating technical capabilities into business strategies can be significant for a firm's success. By incorporating an organization's technical capabilities into the business capability model, companies can enhance their operations and stay competitive.
This integration, also known as technical reference architecture, allows for a better understanding of how technology platforms and infrastructure can support multiple business capabilities. From a technical perspective, this alignment can help automate various business processes and improve the efficiency of the organization's technical services.
One of the key benefits of technical integration is the reduction of duplication and the creation of a standard template for mapping out the enterprise architecture. This, in turn, allows for the technical personnel to focus on more strategic initiatives that directly contribute to the core business objectives. When using a bi system that is in line with the business intelligence needs of the organization, companies can deliver business value more effectively and efficiently.
Overall, the integration of organization’s technical capabilities into the business capability model can lead to improved decision-making processes and a more streamlined approach to IT management.
How Can Bizzdesign Hopex Technology Help in Defining and Modeling Technical Capabilities?
Enter Bizzdesign Hopex Technology—a game-changer that's redefining what technical capabilities can do for business success. Imagine a platform where strategic vision meets operational execution seamlessly, transforming chaos into clarity and ambition into achievement.
Bizzdesign Hopex offers a robust framework for enterprise architecture (EA) and governance, risk, and compliance (GRC). It is particularly useful for defining and modeling technical capabilities within an organization. Here’s how Bizzdesign Hopex technology can help:
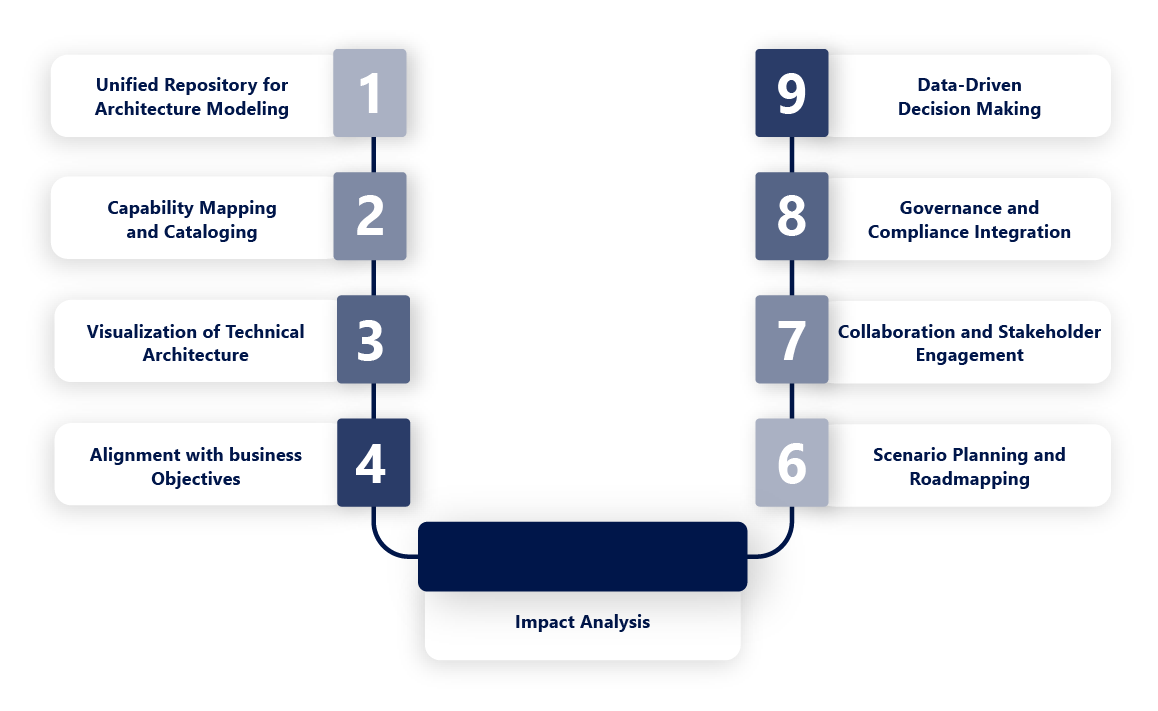
1. Unified Repository for Architecture Modeling:
Bizzdesign Hopex provides a centralized repository where all architectural assets, including technical capabilities, are stored and managed. This unified approach ensures that everyone in the organization can access the same information, reducing inconsistencies and fostering collaboration.
2. Capability Mapping and Cataloging:
Bizzdesign Hopex allows you to create a comprehensive catalog of technical capabilities. You can define and categorize these capabilities, associating them with various components like applications, processes, and technologies. This helps create a clear map of technical capabilities and their utilization.
3. Visualization of Technical Architecture:
Through Bizzdesign Hopex, organizations can visualize their technical architecture, showing how various capabilities are interconnected. This visualization can be in the form of diagrams, matrices, or dashboards, providing a clear and structured view of the technical landscape.
4. Alignment with Business Objectives:
Bizzdesign Hopex facilitates the alignment of technical capabilities with business objectives. You can map capabilities to specific business functions or processes, ensuring that your technical architecture supports your strategic goals. This alignment is crucial for making informed decisions about IT investments and resource allocation.
5. Impact Analysis:
When planning changes to technical capabilities, Bizzdesign Hopex offers tools for impact analysis. This feature helps understand how changes in one capability might affect others or how they might impact overall business operations. This is critical for risk management and for ensuring that updates do not disrupt essential services.
6. Scenario Planning and Roadmapping:
Bizzdesign Hopex allows for scenario planning, enabling you to model different future states of your technical architecture. This is particularly useful for long-term planning and roadmapping, as you can compare different scenarios and choose the one that best meets your business objectives.
7. Collaboration and Stakeholder Engagement:
Bizzdesign Hopex includes features that facilitate collaboration among stakeholders. By using its communication and reporting tools, different teams can work together more effectively on defining and refining technical capabilities. Stakeholders can provide input, and decision-makers can access detailed reports and visualizations to guide their strategies.
8. Governance and Compliance Integration:
With Bizzdesign Hopex, you can integrate governance and compliance requirements into your technical architecture. This ensures that your technical capabilities not only meet current business needs but also adhere to regulatory and internal compliance standards.
9. Data-Driven Decision Making:
Bizzdesign Hopex provides robust analytics and reporting capabilities. By leveraging the data stored in its repository, organizations can make data-driven decisions about their technical architecture, ensuring that their capabilities are optimized for performance, cost, and scalability.
Technical Capabilities and Innovation
Technical capabilities play a crucial role in driving innovation within organizations. Without the necessary technical skills, it is challenging to develop new products, improve processes, or create value for customers.
In the context of research and development (R&D), technical capabilities are essential. R&D teams rely on advanced technical skills to design, prototype, and test new ideas. The ability to experiment with emerging technologies and push the boundaries of what is possible is critical for innovation.
Competitive advantage is another area where technical capabilities are vital. Organizations that possess strong technical capabilities are better positioned to differentiate themselves from competitors. Whether it’s through the development of innovative products or the implementation of efficient processes, technical capabilities can help organizations stand out in the market.
Challenges in Developing Technical Capabilities
Despite the importance of technical capabilities, there are several challenges that organizations may face in developing these skills within their workforce. These challenges include the skills gap, rapid technological changes, and budget constraints.
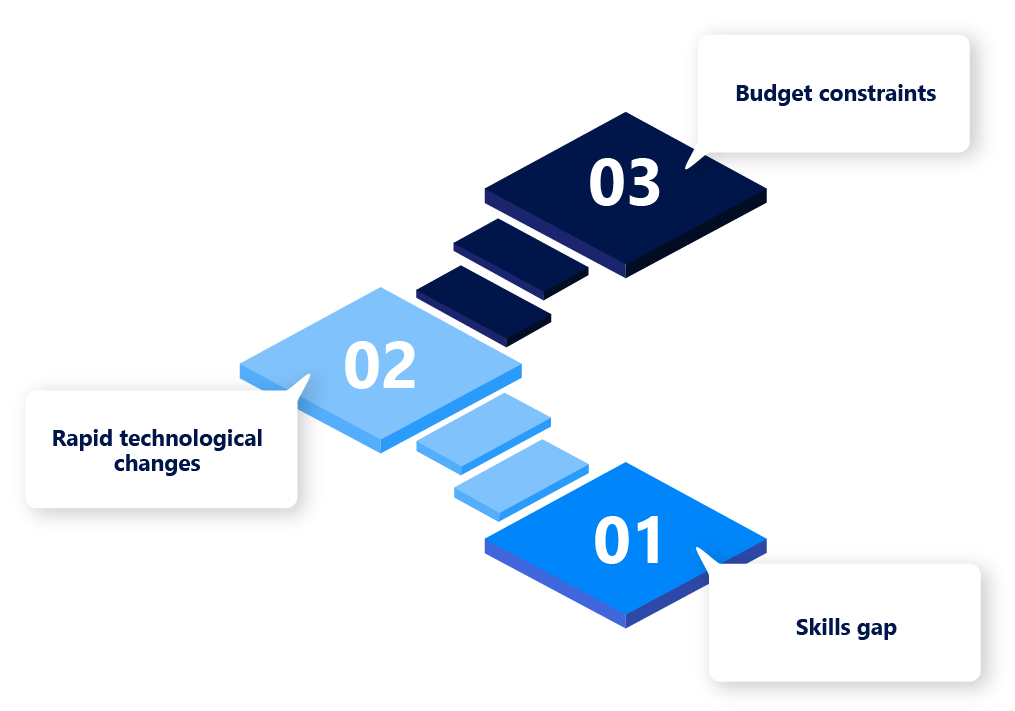
The skills gap is one of the most significant challenges in developing technical capabilities. As technology continues to advance, the demand for skilled professionals often outpaces the supply. This skills gap can make it difficult for organizations to find and retain employees with the necessary technical capabilities.
Rapid technological changes also pose a challenge for organizations. As new technologies emerge, the skills that were once in high demand may become obsolete. Organizations must be proactive in identifying and addressing these changes to ensure that their workforce remains equipped with the relevant technical capabilities.
Budget constraints can also hinder the development of technical capabilities. Investing in training programs, certifications, and continuous learning initiatives requires financial resources that may not always be available. Organizations must find ways to balance the need for technical capabilities with budgetary limitations.
Ethical Considerations in Developing Technical Capabilities
As organizations and professionals strive to enhance their technical capabilities, it is important to consider the ethical implications of these developments. Ethical considerations play a crucial role in ensuring that technology is used responsibly and for the benefit of society.
Data privacy is one of the key ethical considerations in developing technical capabilities. With the increasing collection and use of personal data, organizations must ensure that they protect individuals’ privacy rights. This includes implementing strong data security measures, being transparent about data collection practices, and obtaining consent from individuals before using their data.
Ethical AI is another important consideration. As artificial intelligence becomes more prevalent, there is a growing need to ensure that AI systems are designed and used in a way that is fair, transparent, and accountable. This includes addressing issues such as bias in AI algorithms, ensuring that AI decisions are explainable, and considering the impact of AI on jobs and society.
Sustainable tech practices are also an important ethical consideration. As the tech industry continues to grow, it is essential to consider the environmental impact of technology. This includes reducing energy consumption, minimizing electronic waste, and promoting the use of renewable resources in the production and operation of technology.
The Role of Certifications in Validating Technical Capabilities
Certifications play a crucial role in validating technical capabilities and demonstrating an individual’s expertise in a particular area of technology. Obtaining industry-recognized certifications can enhance career prospects, increase earning potential, and provide a competitive edge in the job market.
Popular certifications include those offered by Microsoft, Cisco, AWS, and CompTIA organizations. These certifications cover a wide range of technical skills, from cloud computing and networking to cybersecurity and software development. Earning these certifications requires passing rigorous exams that test an individual’s knowledge and proficiency in specific technical areas.
The importance of certifications in career advancement cannot be overstated. Many employers require or prefer candidates with certain certifications, as they provide assurance that the individual possesses the necessary skills for the job. Certifications also demonstrate a commitment to professional development and a willingness to stay current with the latest industry trends and technologies.
Building a Technical Capabilities Framework in Organizations
To effectively develop and manage technical capabilities, organizations can benefit from building a technical capabilities framework. This framework provides a structured approach to identifying, developing, and assessing the technical skills needed to achieve organizational goals.
Steps to create a robust framework include identifying the technical capabilities required for key roles within the organization, assessing the current skill levels of employees, and developing a plan to address any gaps. This plan may involve training programs, mentorship, certifications, and continuous learning initiatives.
Critical components of a technical capabilities framework include clear definitions of the technical skills needed for each role, a process for regularly assessing and updating these skills, and a system for tracking and managing employee development. By implementing a technical capabilities framework, organizations can ensure that they have the skills needed to remain competitive in the tech industry.
Conclusion: The Road Ahead for Technical Capabilities
The technical capabilities we've outlined are not just tools for today, but gateways to future innovations. Whether you're a seasoned professional or just starting, embracing these technologies can drastically improve efficiency and productivity. From advanced software solutions to cutting-edge hardware, there's no limit to what you can achieve with the right resources. Staying updated and continuously exploring new advancements is crucial to maintain a competitive edge. So why wait?
FAQs
Technical capabilities refer to the specialized skills, knowledge, and competencies required to perform specific tasks within the technology sector.
Technical capabilities are essential for driving innovation, maintaining a competitive edge, and leveraging technology effectively in the modern workforce.
Organizations can measure technical capabilities through skills assessments, certifications, and performance reviews.
Challenges include the skills gap, rapid technological changes, and budget constraints.
Soft skills such as problem-solving, communication, and adaptability enhance the effectiveness of technical capabilities, particularly in collaborative work environments.
Individuals can enhance their technical capabilities through education, training programs, certifications, and continuous learning initiatives.
Related Articles