In the previous installment in this blog series, we looked into planning and analyzing change in the enterprise by linking the life cycles of elements such as applications and projects. But how do you decide what to do with, for example, your application landscape? Which applications need to be improved, re-platformed, functionally upgraded, or phased out?
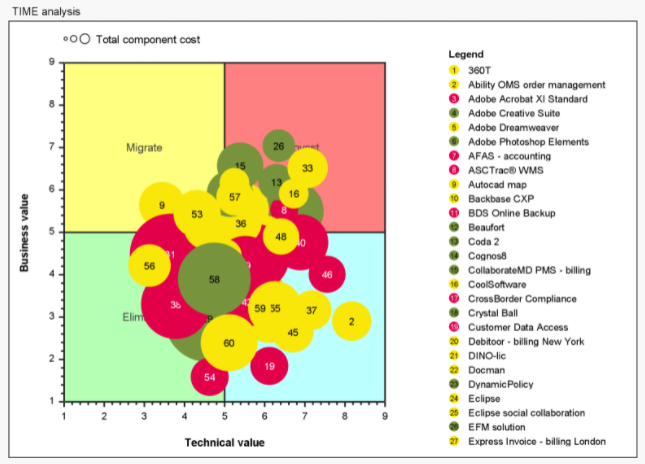
The common approach for this is application portfolio management, which we have described in several previous blogs. Here, I want to focus on the analytics behind charts such as the one below, with the typical business value and technical value axes, the bubble sizes denoting cost and their color showing risk. This type of chart is often used in deciding on the future of applications, and in this example we see four options: Invest (red), Tolerate (blue), Migrate (yellow), and Eliminate (green). This is rather coarse-grained and you might want to use a more detailed set of options, but for this blog I want to focus on how you calculate these values for business value, technical value and risk in Enterprise Studio.

Business and Technical Value Analysis
Of course, there are many factors that you may want to consider in determining the fate of your applications, so the example below is just that – an example – but realistic nevertheless, since it is based on an actual customer situation.
As you will see below, several of the metrics we use to assess business value, technical value and risk are calculated from the structure of your architecture. This really shows the power of using models as a basis for your analyses, something you would never be able to do using simple spreadsheet calculations.
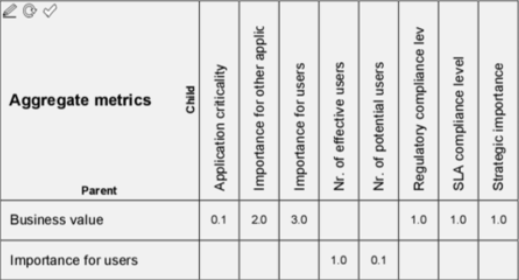
Let’s start with business value. In the screenshot below, we see how the business value metric is constructed as a weighted average of several sub-metrics:

The technical value of applications is determined in similar ways. The most important aspect of technical value is the technical quality of an application. This is determined by the various ‘ ilities’ known from standards such as the ISO/IEC 25010 standard for software quality. Some of these will be based on operational measurements of the application landscape. For example, the stability of an application can be based on the number and severity of incidents; its maintainability can be measured based on the relative effort per change.
Other technical value metrics are based on the structure of the architecture and can be calculated using scripts. The (external) complexity of an application, for instance, can be determined by the number of incoming and outgoing relationships (fan-in and fan-out) of the applications. Still other metrics require an expert opinion, for example the architectural fit of an application, the maturity of the technology used, or the quality of the documentation. Data quality is another important metric, which also requires external assessment. And metrics such as usability may be evaluated via a user survey.
Automated analysis of software code quality is performed by specialists such as CAST, one of our partners. The outputs of such an analysis can be imported in Enterprise Studio and used in your application portfolio and lifecycle management as well.
Another highly relevant metric for assessing applications is their technology risk, depicted with the color of the bubbles above. This aggregates a number of risk types such as:
Next to these metrics, in deciding on an application’s lifecycle you typically also use attributes like size (shown with the size of the bubbles in the figure above), age and cost. This last one, cost, will be addressed in the next installment in this blog series, which deals with financial analyses. Stay tuned!