Dependency Analysis – In my previous blog post, I outlined the value of using analysis techniques to get more business value out of your models. I described one of the most common analysis techniques, impact analysis, and showed how color views and heat maps can be used to depict, for example, the use of applications to support capabilities.
A related and very popular analysis technique is dependency analysis. This is typically used to analyze how different architecture elements rely on each other in the operation of the enterprise. Next to simply traversing the relationships in your models, you can also use dependency analysis to compute aggregate properties of your architecture or processes.
You can use this to define business-oriented KPIs based on various attributes of your IT landscape. For example, calculate the availability of your business capabilities based on the reliability of the underlying applications, which in turn depends on that of the underlying infrastructure.
This is often an eye opener for IT managers who think they are doing well, even If the business is complaining about service disruptions: if a single application has a 99% availability, but your business capability needs 30 of those to work in concert, your aggregate availability is less than 75% (0.9930 ≈ 0.739). A recent presentation by United Airlines at the Business Architecture Innovation Summit in Brussels (June 2017) addressed exactly this topic: using capabilities to define business-driven IT metrics.

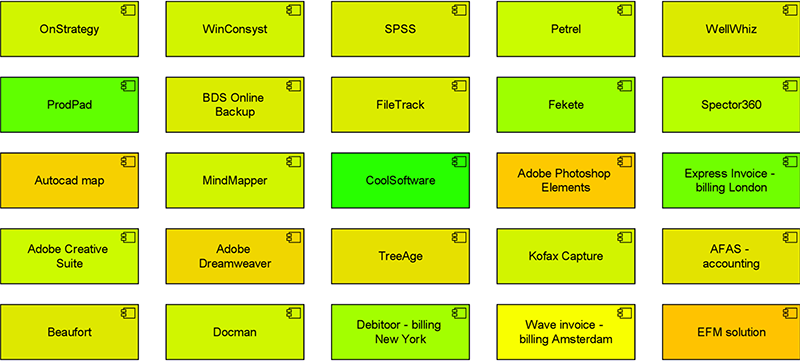
Heat map showing the availability of part of the back-office applications.
As an example, consider the heat map, above, showing the availability of part of the back-office applications of an example. Most are green(ish), which in this color coding implies an availability greater than 98%, so not much to worry about, right?
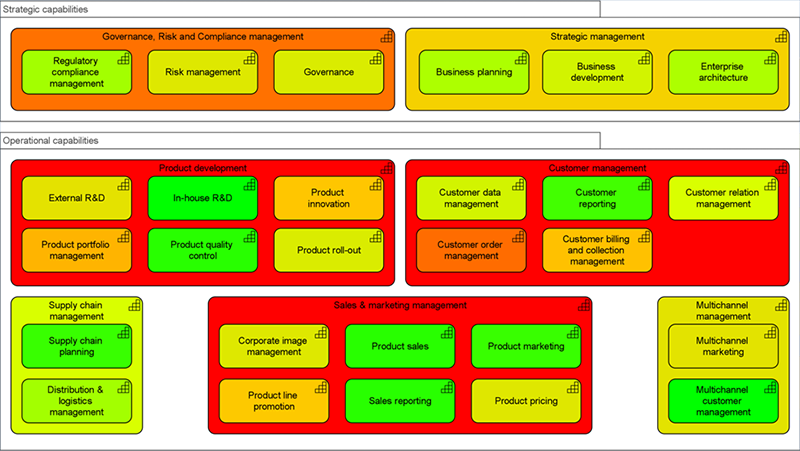
Now look at the partial capability map below, which is from the same model and uses the same color coding, but shows the total availability of each capability based on all its supporting IT. That looks a lot less rosy…

Partial capability map showing the total availability of each capability based on all its supporting IT.
Download our VIVAT customer story and discover how VIVAT rationalized their application landscape and reduced costs.
Using heat maps of your business capabilities like the one above immediately highlights where management needs to focus its attention and the structure of your models allows them to drill down into the underlying issues. In the example, it might make sense to start with capabilities such as ‘Customer order management’ and their supporting IT.
Such KPIs are not just relevant for your IT service management, but can also provide strategically important inputs for business continuity and IT risk management. A related example is identifying which capabilities are at risk from underlying technology that will soon go out of support by its vendor. You can add information on the technology lifecycle from sources such as Technopedia and propagate that through your model, similar to the previous examples. This helps you prioritize areas where you need to upgrade your IT first, based on the business-critical core capabilities it supports.
To create these types of analysis, we use the semantics of ArchiMate’s relationships such as Serving, Realization and Flow. The standard functionality of Enterprise Studio provides extensive support for creating various kinds of views, analyses and dashboards, and we can provide you with many examples to build upon. In addition, you can also create highly customized and intelligent analyses for specific purposes, using the built-in scripting language of Enterprise Studio.
These examples just give a small sample of the many ways to extract more value from your models and create business-focused KPIs and views. More is to come in the next blog posts in this series. Stay tuned!