
Previously, I have blogged about stakeholder management and showed you some useful techniques to support this important part of enterprise architecture. In this blog post, I want to address different ways to share architecture information with different types of stakeholders involved in changing your enterprise.
When communicating about architecture, you need to consider the type of stakeholder you are addressing and the information he/she needs from your architecture. As originally described in Enterprise Architecture at Work and also mentioned in the ArchiMate® standard for architecture modeling, there are three main goals in communicating change:
Next to these communication goals, you also need to take into account the way people prefer to consume information:
Because architects are often visually oriented, we tend to show the fruit of our efforts by means of diagrams. But this is not always the best option; it mainly works for 1) designing and 2) visually oriented people. In management, we often find people with a legal background. They are ill-served by diagrams and other pictures, but instead require text, while those with a background in finance need numbers, tables, and charts. Speaking their “language” is an important part of effecting the change you want to see.
The information contained in architecture models can be displayed in many forms – not just diagrams. In particular, the various dependencies between the elements of your architecture can be exploited to create cross-cutting insights that serve the needs of various stakeholder groups. Displaying this information in multiple ways may help different types of stakeholders gain the understanding they need to move forward.
Below, you see the technology obsolescence risk of (part of) the business capabilities of an organization. The end-of-life dates of various technologies, as provided by Technopedia (which we can import in our platform), are aggregated across the entire architecture via, in this instance, applications and business processes supporting each capability. Such an analysis helps management address business continuity risks of old technology, and also decide where to invest in upgrades or replacements.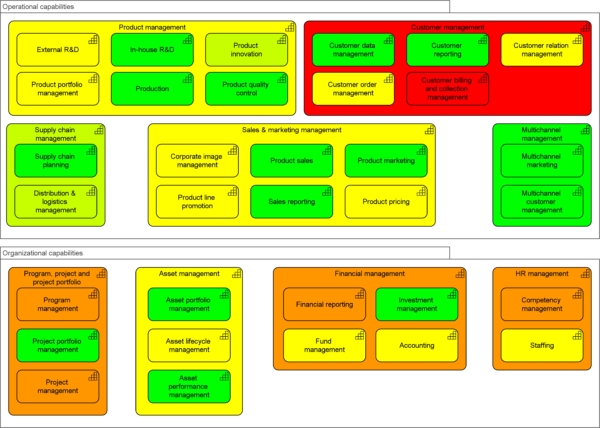
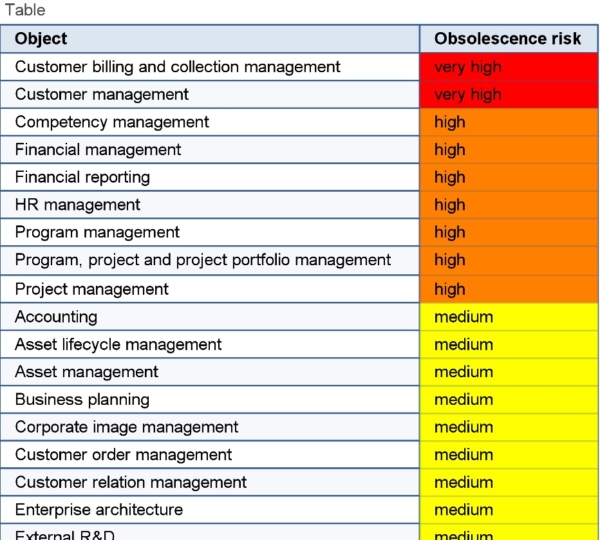
A heatmap like the one above works best for visually oriented people, who will immediately zoom in on the red capabilities at the top right. The same information can also be shown in a table, as demonstrated below. This may be more suitable for people who prefer text or tabular information.
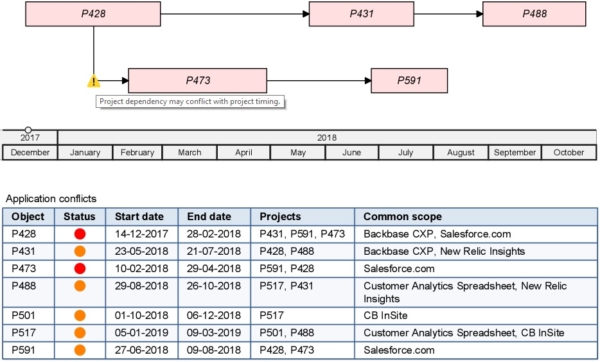
Below is another example: a planning diagram with additional tabular information on project conflicts. This is the type of information a manager needs to assess the impact of delaying a project, or the information a product owner requires when deciding whether or not to push a feature to the next sprint.
At the top, we see that the delay in the first project on the timeline leads to a problem with the second project (the yellow warning sign), since that relies on the first. The table at the bottom shows (in red) that there is also an indirect potential conflict: both projects work on the same system, so if they overlap in time, they may step on each other’s toes.
Next to the diagram and the table, the text you just read is, of course, a third description of this information. Any diagram or table should come with such an explanation. Such natural language text can even be automatically generated from models. But we can go beyond that: If you have attended the presentation given by our customer and innovation partner, Schaeffler AG, at the Gartner Enterprise Architecture Summit in London, you have seen a demonstration of our chatbot, which allows you to talk to your architecture models!
Do you want to know more about the communication capabilities of Enterprise Studio and HoriZZon? Contact us for a demo!