HSBC’s ‘data-driven living architecture’ enables strategic C-level decisions
We use our data-driven architecture to curate architecture artifacts that inform and influence our business and technology strategies. This allows us to maintain a ’round-trip’ architecture from our data asset repositories to intent or design into production and back again to update our repositories to reflect what we’re producing.
Country: United Kingdom
Industry: Banking
Company size: >232 900
Revenue: USD 51 billion
Results:
Founded in 1865, HSBC is one of the world’s largest banking and financial services organizations. The bank operates in an est. 64 countries and serves around 39 million customers ranging from individual savers and investors to some of the world’s biggest companies and governments. The IT department consists of an estimated 45,000 employees, including 1,500 architects.
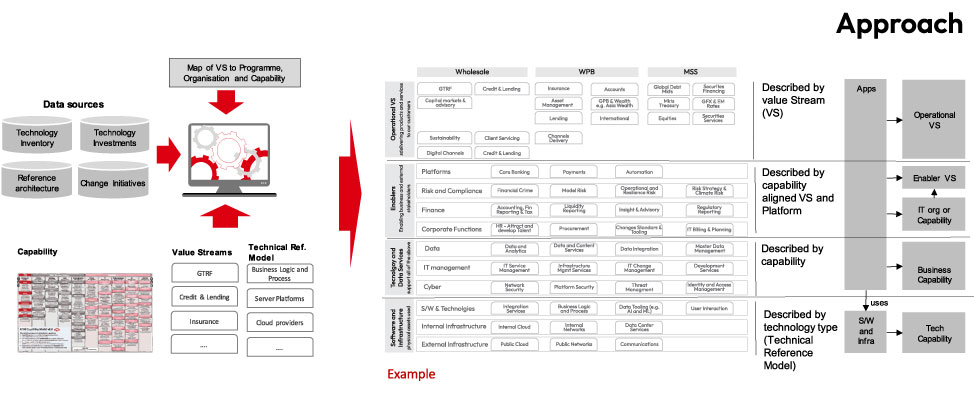
HSBC’s global CIO tasked the enterprise architecture team to create an aggregated overview of the bank’s technical landscape mapped against its business services and capabilities. The objective of this overview, known internally as a ‘bank on a page,’ is to provide strategic insights into technologies, enable scenario planning to assess investment impacts, and enhance cost transparency.
However, compiling the initial’ bank on a page’ project highlighted the complex nature of HSBC’s organizational infrastructure. With thousands of applications spread across several regions and three global lines of business: Wealth and Personal Banking, Commercial Banking, and Global Banking & Markets, it became difficult to consume the landscape.
Moreover, apart from the Group Enterprise Architects, each line of business had its own Chief Architect and a team of architects ranging from enterprise, solution, data and business architects,. Each team used different taxonomies and ways to collaborate and speak to the business. Capability models were also addressed and constructed in different ways.
To address these challenges and improve decision-making processes, the architecture team recognized the need for an enterprise architecture platform. The team conducted a thorough assessment of software available on the market. Bizzdesign emerged as the top choice based on clear case study scoring and its ability to meet HSBC’s specific needs.
HSBC engaged Bizzdesign to assist in visualizing and automating the models used to present information to stakeholders. Previously, the bank relied on tools like Microsoft Visio and PowerPoint, typically generated separately by architects and business teams. These models were sourced from various information channels and created in isolated silos within different lines of business, service line architecture, domains, value streams, and regions. HSBC also wanted to use Bizzdesign to standardize architectural efforts and provide a more unified and streamlined approach to presenting the information.
The architecture team’s first approach was to assess their data sources: determine whether they could be trusted, and identify inventories, asset repositories, and models that could be reused. They also analyzed the bank’s organizational structure, examining how lines of business, service lines, and value streams were structured. In collaboration with business architects and stakeholders, they developed a shared taxonomy for all lines of business to follow.

The team then integrated data into Bizzdesign from approximately eight sources, from spreadsheets to tools like ServiceNow. Implementing a standardized business capability model was a complex task that involved defining capabilities, incorporating industry standards, and engaging in extensive discussions to address nuances and achieve consensus.
Once they had gathered the necessary data sources, capability model, and organizational insights, they imported it into Bizzdesign. This allowed them to create a comprehensive model depicting the relationships between value streams, programs, organizations, applications, capabilities, and business processes. They enhanced the imported data with additional metadata, such as charges, the total cost of ownership, and strategic statuses, to generate specific landscapes and roadmaps tailored to different lines of business and regions.
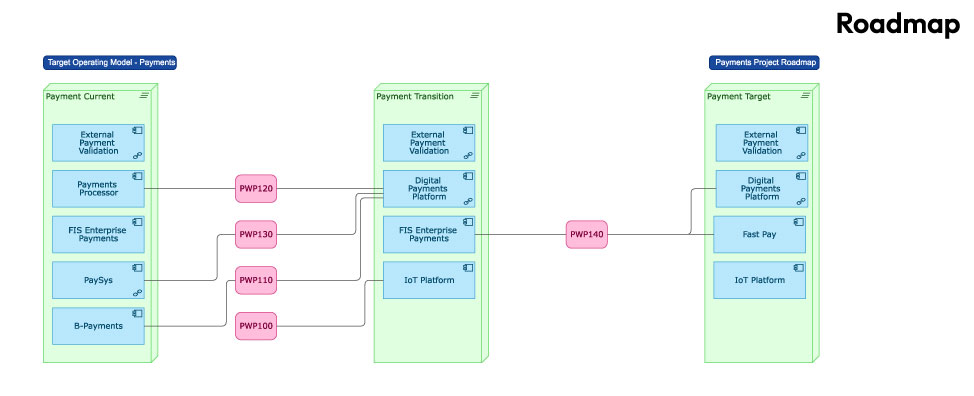
The resulting “bank on a page” view gave stakeholders a consolidated and dynamic representation of HSBC’s architecture. While displaying thousands of applications on a single page was not feasible, the platform provides dropdown menus for exploring applications associated with specific value streams. Stakeholders could access information on strategic applications, total cost of ownership, and project impacts, enabling informed decision-making. The platform also facilitated the generation of roadmaps, almost 200 to date, based on application lifecycles, strategic categorization, and work packages, allowing stakeholders to make informed decisions.

To accelerate the adoption of Bizzdesign’s platform, HSBC provides an in-house Enterprise Architecture Modeling tool Training Curriculum which is easy to follow. Training for the CIO and CXO level stakeholders focuses on aggregated insights and hotspots, utilizing simple reporting tools in Horizon. Enterprise and solution architects received more detailed training, enabling them to consume data and visualizations at an atomic level. Designers receive in-depth training through videos and certification processes.
As more stakeholders use the platform and share their artifacts, adoption spreads quickly throughout the organization. The ease of transitioning between different information views, such as landscapes, roadmaps, and cost charts, contributes to adopting the platform.
We’re now able to consolidate and visualize our infrastructure landscape, align it with business objectives, and engage stakeholders from architects, Cef Architects right up to our CIO, CFO, and CEO.
Since HSBC’s IT team has been leveraging Bizzdesign, they’ve experienced several benefits:
Automation reduces artifacts creation from weeks to days
Bizzdesign’s automation capabilities have significantly streamlined artifact creation. Previously, artifact generation took weeks, but now it can be done in days due to centralized information in a single repository. This efficiency improvement has enhanced the working methods of enterprise architects, enabling them to meet senior management’s needs better.
Single pane of glass visualization enhances collaboration
HSBC’s implementation of Bizzdesign’s enterprise architecture platform enabled a unified visualization of applications across different perspectives. The team modeled Gartner’s TIME methodology in the platform, allowing strategic allocation of applications to business or technology. This comprehensive visualization improved communication with senior management by offering a complete organizational overview. The platform facilitated application prioritization and investment discussions, aligning with business goals and technological capabilities.
Standardized roadmaps allow impact assessment across areas
Due to standardizing data collection and improved data quality, group-level reporting of architecture KPIs and controls has become more accessible. By consolidating data sources into Bizzdesign’s standardized form and using the ArchiMate modeling language, HSBC can aggregate and analyze information across lines of business, value streams, and regions. This enables them to generate global views of roadmaps and assess the impact of work packages or applications across multiple areas.
Improved data quality driven by visualization
Visualization in Bizzdesign has helped improve data quality by addressing inconsistencies and discrepancies in data sources across various repositories. With the ability to visualize the data in a consumable format, stakeholders can easily identify incorrect information and take corrective actions. Visualization proves essential in managing the sheer volume of data and facilitating data correction to maintain data integrity.