State of Enterprise Architecture 2023
The State of Enterprise Architecture report results are in! Nearly 1,000 enterprise architects and other senior IT and business stakeholders participated in this year’s survey.
We set out with 4 overarching questions in mind:
- Are teams equipped to meet their organizations’ demands?
- How mature are the practices of today?
- Are those practices making a difference to IT and business change initiatives?
- How can organizations amplify the impact and effectiveness of their resources?

Enterprise architecture’s search for influence
According to respondents of the report, most teams still need to improve how the mission and value of enterprise architecture are perceived across their organization. Sixty-five percent of respondents saw room for improvement, as illustrated in figure 1 below.

Fig. 1: Extract from EA Maturity Self-Assessmen
The need to improve this perception is born out in other survey findings. Only 36% of respondents claimed to have adequate resources in their team. Even 44% said they were under-resourced, and 20% said their team was severely under-resourced.
Ensuring senior management understands enterprise architecture value is a good recipe for gaining the budget and headcount required.
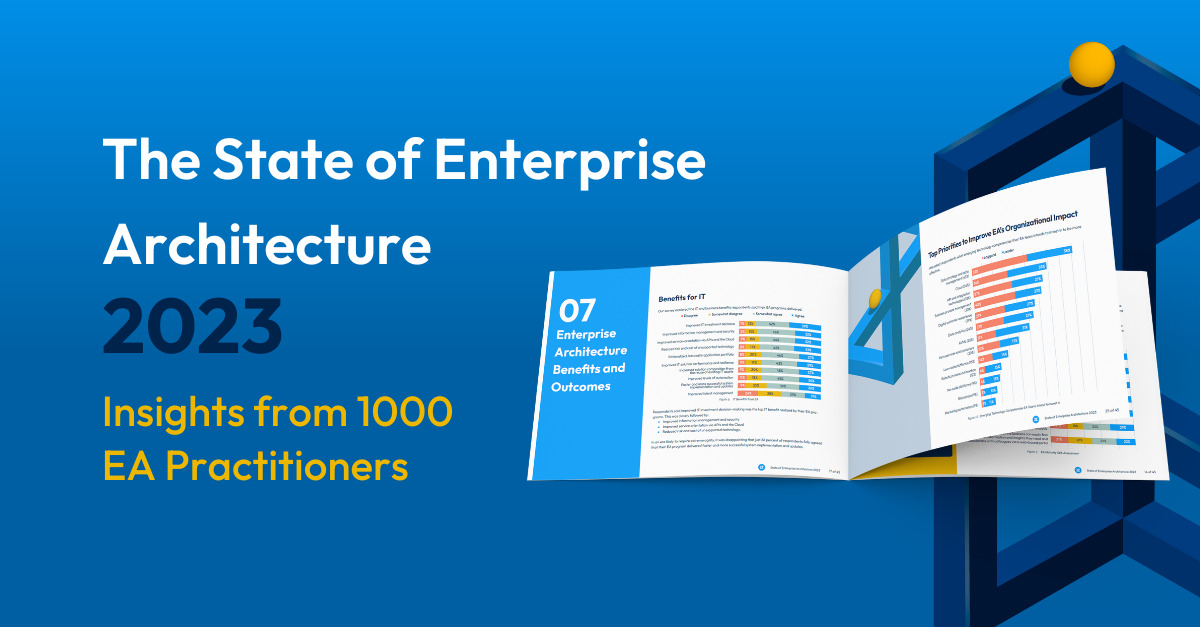
So, it was logical to hear from our survey respondents that improving this picture was a top priority for the year ahead. As shown in figure 2, when asked to identify their top three improvement priorities to increase enterprise architecture’s impact at their organization, improving the communication of their value to the business top scored with 55%

Fig. 2: Top Priorities to Improve EA’s Organizational Impact
But playing devil’s advocate for a moment, I’d like to suggest that we treat this objective as an outcome rather than a goal in itself.
A team isn’t going to hire PR consultants to improve their customers’ perceptions. So focusing on this outcome seems a non-starter to me.
Looking at the other improvement priorities that survey respondents said they’d focus on in 2023; one doesn’t have to go far down the list to find a more practicable suggestion. In third place, we have: “Deliver more strategic insights to support strategy and investment decisions.”
Surely, by moving this to priority #1, teams will have more value to communicate to the business and thereby gain more active support from senior management.
One of the learning resources we signpost from the main report is our guide to supporting boardroom decisions with data and enterprise architecture.
For those that want to improve the perception of enterprise architecture in their organization, this seems an excellent place to start. It’s a case of perception being reality, where reality had better come first.
We signpost several other helpful learning resources in the report, including:
- How to better support cybersecurity, risk, and compliance priorities
- How to facilitate enterprise-wide collaboration
- The benefits of integrating enterprise architecture and BPM
- Six steps to create an agile enterprise architecture management capability
Plus, we describe a package of assessment instruments and a shared maturity model to help identify improvement opportunities for your enterprise architecture practice.
What else can you learn from the report?
With 44 pages packed with charts and analyses, there’s lots more that you can learn from the 2023 State of Enterprise Architecture report:
- Changing demand and priorities: Learn how the demand for enterprise architecture services is growing and what kinds of projects drive the demand.
- Resourcing talent: How are teams resourced, and how hard is it to recruit and retain key talent?
- Maturity self-assessment: How did respondents score their maturity, and how do you compare?
- Benefits and outcomes: To what degree are organizations delivering the benefits and outcomes needed from their endeavors?
- Operational trends: What systems and content types have organizations integrated with their enterprise architecture tools? What enterprise architecture deliverables and artifacts are most used? How successful are teams at engaging with IT and business stakeholders? Respondents’ top improvement priorities, and more.
- The maturity advantage: How do high and low maturity organizations compare on numerous performance measures?
- How to amplify the impact and effectiveness of your enterprise architecture resources: We explore the force-multiplier effect of a fit-for-purpose enterprise architecture platform.
The report highlights 9 key findings:
- Increasing demand for enterprise architecture services. Sixty-two percent of respondents said that demand for enterprise architecture services had increased in the past year. Of these, 17% said that demand had increased significantly.
- Enterprise architecture teams are under-resourced. Sixty-four percent of respondents said their team was under-resourced or severely under-resourced. Seventy percent of respondents described hiring and retaining enterprise architecture talent as a challenge.
- There’s a maturity gulf between high and low performers. Analysis of self-assessment scores revealed a 5.8 times maturity gap between the top quartile “EA Leaders” and the bottom quartile “EA Laggards.”
- Maturity leaders claim an organizational agility advantage. According to respondents, organizational agility is three times higher for those with top quartile maturity than those with bottom quartile maturity.
- Maturity leaders deliver superior benefits. Compared to laggards, leaders were nearly three times more confident that their practice delivered numerous IT and strategic business benefits.
- Most teams still struggle to provide strategic business outcomes. Only 26% of respondents fully agreed that their practice delivered strategic benefits, including improved organizational agility, identification of innovation opportunities, improved CX, and faster time to market.
- Selling enterprise architecture’s value to the business remains the top improvement priority. Asked to identify their top three improvement priorities to increase enterprise architecture’s impact at their organization, “Improving the communication of enterprise architecture’s value to the business” came first with 55% of respondents.
- Stakeholder engagement is higher among maturity leaders. Maturity leaders are more than twice as successful at increasing stakeholder engagement and consumption of enterprise architecture insights compared to maturity laggards.
- A capable enterprise architecture management platform improves the value of deliverables. On average, those happiest with their enterprise architecture tooling were 44% more likely to agree that their deliverables were current and relevant to support change compared to those least satisfied with their tooling.
The findings clearly show that mature capabilities are fundamental to organizations’ ability to make well-informed business and technology change decisions. Moreover, organizations with the most mature capabilities were least likely to highlight that their teams were under-resourced.
Download the full report for more information