In previous blogs, we have written about the combination of structure and data to create novel insights into your enterprise, and about how this can support creating a Digital Twin of your Organization. To reiterate, a digital twin is a digital representation of a real-world entity or system.
Such a model enables all kinds of advanced analytics, for example for:
Digital twins are used in all kinds of settings in the physical world, for example:
And the Internet of Things technology will enable many more use cases. A Digital Twin of your Organization (DTO) is exactly the same, a digital model that shows how your enterprise is constructed, operates and evolves. Now this idea is not exactly new, even though the term was coined by Gartner only recently. The enterprise models we at Bizzdesign have been supporting in our products for many years are of course such digital representations of your organization!
There are some new developments, however. In the past, such models were designed and maintained separately from the business-in-operation. Nowadays, we can integrate live operational data into our models, from many different sources. As argued in the first blog mentioned at the top, this offers a whole range of new possibilities.
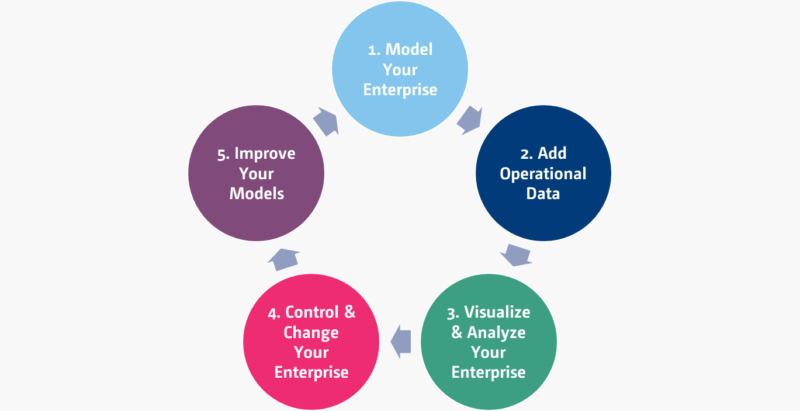
But how do you go about building such a digital twin? We use a five-step iterative process, shown below.

The first step in creating a DTO is of course to use formalized models of your:
In many different blog posts and whitepapers, we have explained these kinds of models, so we will not elaborate on those here. One important thing to note, however, is that increasingly, you can use automation to speed up modeling the current state of your enterprise. For example, you can import information from workflow tools, process mining, CMDBs, et cetera, and generate models instead of building them manually.
Of course, the expertise of architects and other designers is still essential in creating the necessary abstractions that help you see the forest for the trees: deciding what to abstract from, where to generalize and which details are irrelevant is not something we can easily automate. Moreover, designing the future of your enterprise cannot be automated either.
This is not based on one monolithic, all-encompassing model-of-everything. Rather, different aspects are captured in different models, maintained by different (but collaborating) communities and disciplines. And all these various models are interconnected to form a coherent backbone that offers a line of sight between the strategic direction, operations, and change of the enterprise.
The second step in creating a DTO is to add relevant operational data from the live enterprise to your integrated models. This can include, for example:
Of course, these are just some examples, and the specifics of your own enterprise will determine what kinds of data are available and useful. There may be some battles to fight within your organization to gain access to certain data sources, but that is beyond the scope of this blog.
More importantly, data quality is key: garbage in, garbage out. So before adding any data to your model, you should evaluate that data according to common quality attributes, such as:
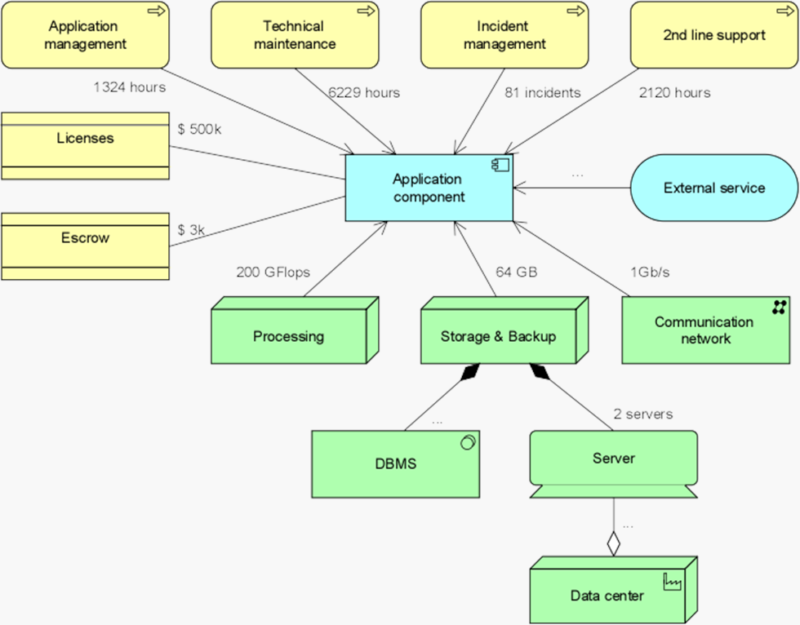
You can aggregate and integrate the data you added in many different ways. The picture below, for example, shows a cost calculation model for applications, where the different cost drivers are added up according to volume, resource usage et cetera. The aggregated cost per application can in turn be distributed to, for example, the business units of the organization based on the intensity of their use in the various business processes.

Our Horizzon platform offers excellent data integration capabilities. You can import information from all kinds of sources, ranging from Excel files and SQL databases to sources such as ServiceNow, Technopedia, and many more. The underlying high-performance streaming platform provides the foundation for integrating real-time and high-volume data.
Once you have enriched your models with relevant data, you can use this to perform various kinds of analyses. Think of aspects such as:
And this is just a small set. Our whitepaper on analysis techniques may be an inspiration here.
To convey the right message and create a solid understanding of your enterprise, suitable visualizations are also key. This may range from simple tables and lists via ‘classical’ models in languages like ArchiMate and BPMN, to colorful heatmaps, charts, and interactive dashboards.
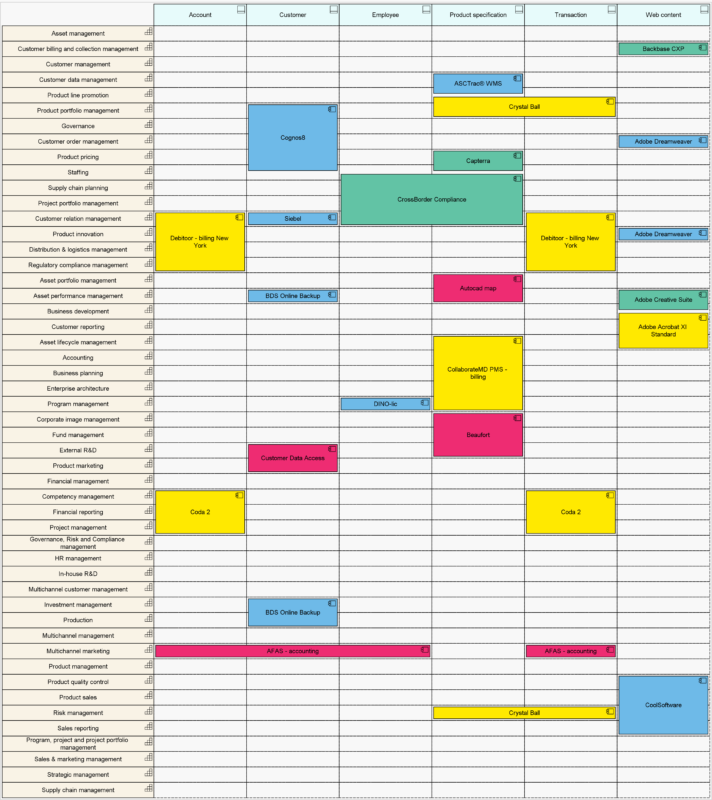
Below you see a landscape map in which the applications supporting certain business capabilities (the vertical axis) for certain information domains (the horizontal axis) are plotted, colored according to their lifecycle advice (click to zoom): blue = tolerate, green = invest, yellow = migrate, red = eliminate. This advice is based on a typical ‘TIME’ application portfolio analysis, based on different business value and technical value metrics of these applications (see our Application Portfolio Management e-book for more on this). That data, in turn, comes from a number of external sources, ranging from user surveys to call logs from the service management department, and from automated code analysis to vendor data from a source like Technopedia.

As you can see, this figure integrates a lot of useful information in one diagram, giving you an overview of the potential impact of, say, replacing an application on the business capabilities supported and the data domains involved.
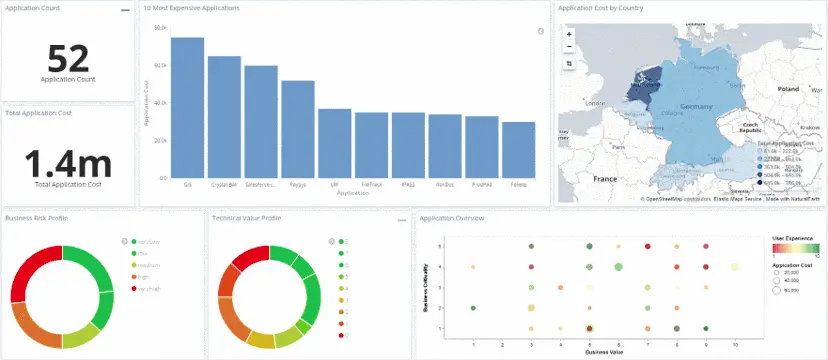
In the next figure you see another example, an interactive dashboard in HoriZZon. You can select an element (say the very high-risk applications) and the rest of the dashboard adapts and filters to only show those applications in all charts. This way, you can drill down into the salient issues of your enterprise and support decision-making.

Our whitepaper on enterprise views to improve strategy execution shows some examples of views that may support a management audience, the key stakeholders of the next step.
This is where the rubber meets the road. Based on the analyses and visualizations from the previous steps, decision makers at all levels of the organization can use the information to direct, control and change the enterprise. This may range from simple parameter optimizations in a production process by domain experts on the ‘shop floor’ to major business transformations initiated by C-level management. Since all the information is connected in a coherent model space, any change can be evaluated up-front as part of a holistic picture. Vice versa, changes in relevant data from the outside world can be fed into the Digital Twin in order to assess their impact on the enterprise.
Key in changing your enterprise is analyzing the impact of changes and planning those changes in a smart way. We do not advocate a ‘big up-front design’ approach, with huge, rigid multi-year transformation plans. Rather, in an increasingly volatile business world you need to use an interactive approach where your plans are updated regularly to match changing circumstances, typically in an agile manner. The figure below shows a simple example of dependencies between a series of changes, depicted with the pink boxes. A delay in ‘P428’ causes problems in the schedule, since ‘P472’ depends on it. Moreover, since the two changes overlap in scope (shown in the right-hand table), they could potentially be in each other’s way when they also overlap in time. This information is calculated from the combination of project schedule and architecture information, a clear example of the value of integrating this kind of structure and data in a Digital Twin.

This is of course just one example of managing change in your enterprise. In other publications, we have shown many more of these kinds of analyses. Or just get in touch with us for a demonstration if you want to see more.
Finally, you have to close the loop. As George Box famously said: “All models are wrong but some are useful.” Your model is never a complete picture of reality, but you should keep improving it. First of all, you should check their quality: Are your models technically sound? Are they consistent? Are they understood? Second, you need to make sure that your models don’t deviate from reality too much. Do they still represent the real world accurately enough? What has changed out there? Do you need to recalibrate?
Moreover, you can enhance your models by adding more data sources. Building a DTO is not a one-shot exercise; it is a journey, not a destination. You gradually add more and more information, finetuning and enriching your model over time. Finally, to improve the quality of your models, you need to make sure that this feedback loop is fast enough. That way you can prevent your models from becoming outdated.