In my recent blog series, I highlighted the importance of communication for strategic transformations. This affects several functions and various roles in your organization by asking different questions, such as:
Using a holistic framework to capture enterprise architectures, such as ArchiMate, enables you to answer these and many more business questions. But how do you separate the architectures into simple diagrams to make them easier to create and use?
A standard approach to describe architectures is the ISO 42010, which includes the definition of viewpoints as a specification for constructing diagrams. These diagrams, in return, serve different roles and highlight their concerns. This proven approach is used in TOGAF, ArchiMate and other frameworks.
After defining your stakeholders and their concerns, you probably end up with a list of business questions you want to answer. The challenge is knowing how to cut the information you gather into easy-to-read diagrams. To achieve this, you need to reduce the complexity of the diagrams. Reducing the complexity serves in two ways:
1. Reducing complexity when creating diagrams (by the expert)
2. Reducing complexity in consuming diagrams (by the relevant stakeholder)
There are different techniques to reduce the complexity, many of which are described in the book, “Enterprise Architecture at Work,” from Marc Lankhorst, et al. Key indicators that impact the visual complexity of a diagram are the number of different icons and relation types shown.
In this case, we use the ArchiMate framework to define viewpoints that describe what you are allowed to use to create a diagram. The main concepts in ArchiMate are (architecture) elements, such as capabilities, business processes or applications, as well as the different relation types. This leads to two approaches guiding the definition of viewpoints: selecting the relevant elements or selecting relation types.
Selecting the elements for a viewpoint may put you at a disadvantage, however. This is because you are often allowed to use five or more different relation types between two objects, which forces you to select the correct relations out of a provided list. The other approach to creating viewpoints is to group the relations and then select the elements. In ArchiMate, there is already a grouping of the relations into structural, dynamic, dependency, etc., which can be used to guide the creation of simpler diagrams with low complexity.
You can see how to create diagrams in the examples below, which begins with dividing the set of relations into separate groups. The ArchiMate framework describes:
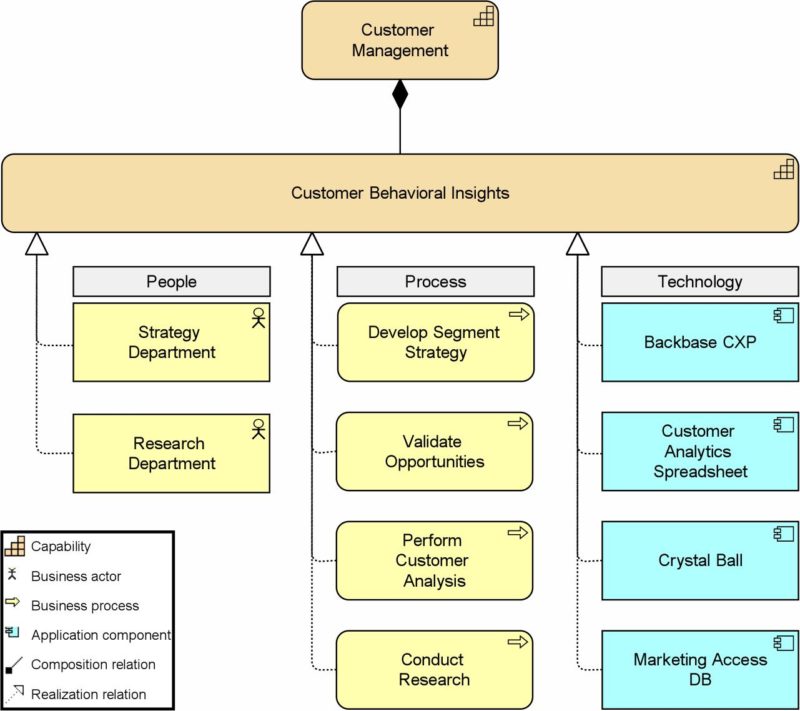
Starting with structural relations, I only use the composition relation to describe the hierarchy of elements and the realization relation to describe what the elements realize. You can use them to show what capabilities are composed of and to show which application(s) realize a capability. Diagrams with this information help answer the business questions mentioned above. To add to the description of key elements of a capability, I add business processes and applications to this viewpoint. That way you can get an overview of which key people, processes and technology you need to realize a specific capability.

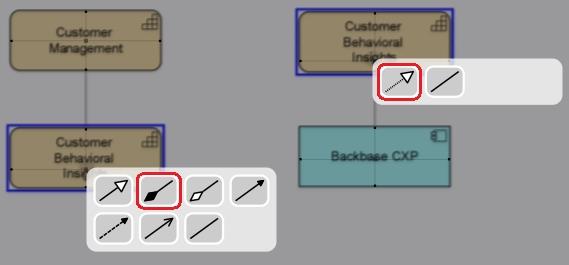
Remember, viewpoints describe what you are allowed to use to create a diagram. The diagram above shows an example of a viewpoint that allows only the usage of the ArchiMate concepts of capability, business actor, business process, application component, composition and realization relation. With this viewpoint, we limit available concepts for this type of diagram and the possible relations between two elements significantly. For relating capabilities, we are only allowed to use one relation instead of seven. To relate people, process or technology to capabilities, we are only allowed to use one (instead of two) possible relation types (see picture below).

Using the same pattern in different layers
You can use the above pattern to create more structural diagrams by using these relation types to compose elements or to show what elements realize. I will show that in a future blog, along with other structural viewpoints, to demonstrate the application of the same pattern along different architecture layers.
Stay tuned for more standard viewpoints that will help you create simpler ArchiMate diagrams for your change initiatives!
Update: The functionality to configure your own viewpoints is also part of our new version of Enterprise Studio. If you want to see this and other powerful functionalities of our solution, please contact us at https://www.bizzdesign.com/contact.