
Bizzdesign Unify: An AI-native platform for faster, better transformation decisions.
Solution Architecture Design: Guide for Modern Enterprises
Discover the intricacies of solution architecture design. Learn about the relationship between design and decision-making to solve complex problems.
Definition
Solution architecture design is crucial as it ensures the architecture is suitable for its intended purpose. This process involves collaboration and gathering information from various stakeholders, including business and development teams.
Reliable designs provide blueprints for new projects, which often start from scratch. In digital transformation, effective design aids in change management and boosts an organization’s capability to adapt to change.
Structured design work can reduce failure rates in change projects by enhancing the quality and impact of deliverables, ranging from high-level contextual designs to detailed technical diagrams. It also aids in making informed decisions about trade-offs between time, risk, and cost.
Therefore, design is essential for producing high-quality solution architecture deliverables and is vital in nearly all change processes.
The relationship between design and decision-making
In solution architecture, decision-making, and design are closely connected. A solution architect's decision-making process typically involves understanding the constraints of a project and deciding what to prioritize or optimize for. This decision will influence the design of the solution architecture.
Furthermore, it often involves deciding the level of technical debt they are willing to accept. It must be managed by capturing its cost, assigning a severity, and potentially assigning a risk level. Various stakeholders then review the designs and architecture created to ensure their fitness for purpose. This combination of decision-making and design forms the bedrock of solution architecture.
Solution architecture design principles and standards
The design standards in solution architecture refer to a set of principles, norms, and procedures that guide the design and implementation of solution architectures. These may include standard deliverables such as solution design documents, established diagram types, and consistent use of data sources.
Standards often draw upon recognized architectural patterns and frameworks and typically dictate the use of specific design tools and modeling techniques. The ultimate goal of these standards is to ensure consistency, high quality, and alignment with broader organizational goals in solution architecture designs.
10 Key principles in solution architecture design
- Modularity and scalability are key principles in solution architecture design. This modularity ensures scalability, allowing the solution to grow and adapt as the business evolves.
- Architectures should be optimized for performance and efficiency, ensuring systems can handle expected workloads and deliver acceptable response times.
- Solutions must be designed to handle failures and recover gracefully. This often involves redundant components, failover mechanisms, and disaster recovery plans.
- Solutions should be designed to interact seamlessly with other systems within and outside the organization.
- Effective data management is crucial in modern architectures. This includes data storage, retrieval, processing, and governance considerations.
- Usability and user experience should guide the creation of interfaces and user experiences. Solutions should be intuitive, accessible, and meet the needs of their intended users.
- Architects should design solutions that are easy to maintain and manage over time. This includes robust monitoring, logging, and automation to streamline operations.
- Security should be integrated into the architecture from the outset rather than treated as an afterthought.
- Cost efficiency is an essential factor to consider in solution architecture design. Architects should consider infrastructure costs, licensing fees, and ongoing operational expenses.
- Compliance and regulatory requirements must be adhered to. Depending on the domain, solutions must meet relevant industry regulations and compliance standards, such as GDPR, HIPAA, or PCI DSS.
Source: Bizzdesign Horizzon Bizzdesign Horizzon saves solution architects time by providing out-of-the-design coaches
Solution architecture design principles and standards
A design pattern in solution architecture is a proven design that helps illustrate architecture best practices for a given problem. These patterns can guide the reuse of successful designs and concepts in new contexts, thus accelerating the solution design process and reducing associated risks.
They can be very specific and designed to support particular architectural groups with proven methods of working that have been refined over time. An example of a design pattern given in the context includes implementing role-based access control for a new application.
Source: Bizzdesign Horizzon Bizzdesign’s enterprise architecture platform includes out-of-the-box templates and design guidance to produce high-quality solution architecture designs
An example of a design pattern is role-based access control. Patterns can be reused for specific criteria or problems that need to be solved. Other patterns exist in a catalog or library that covers various categories, such as integration and cloud solutions.
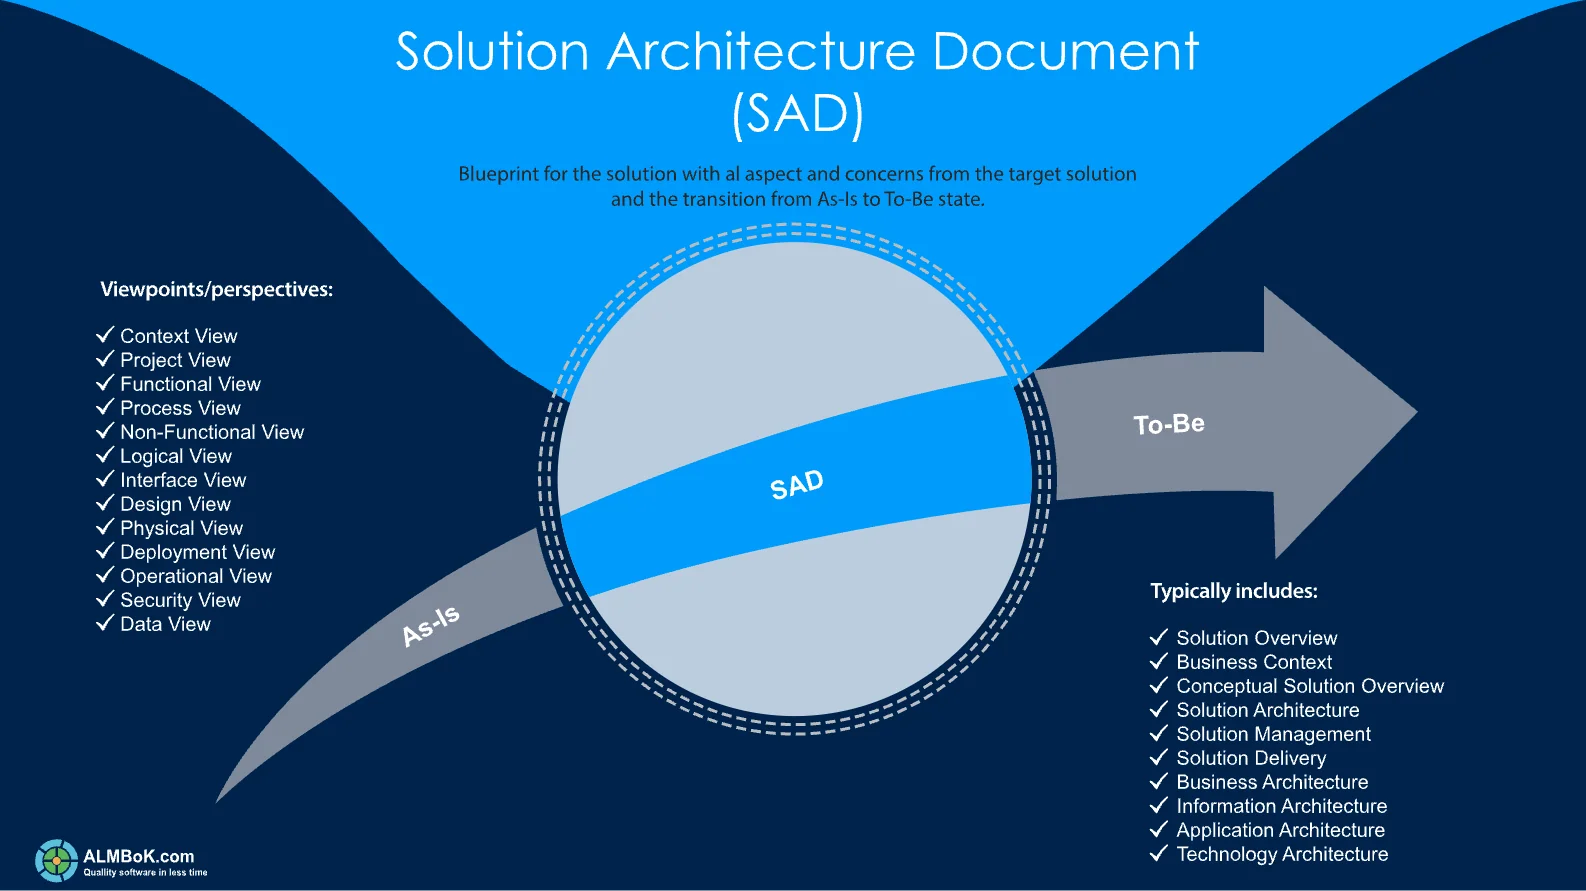
What does a solution architecture design document include?
A design document in solution architecture is a comprehensive, detailed written material that outlines a certain project’s concept, objective, and strategies. This addresses the specific architecture of the solution, detailing the components, their relationships, and how they will interact to provide the proposed solution.
It’s usually created as part of the solution architecture process and is designed to guide the implementation team. It is a standard deliverable communicating the architectural vision to the business and IT project teams. It commonly includes project scope, use cases, logical view, data flow diagrams, and assumptions and risks.
Source[1]
Key sections in a solution architecture design document
The components of a solution architecture document may include project scope, process models, use cases, logical views, data flow diagrams, assumptions, risks, and various other sections, depending on the specific nature of the project. The document could also include diagrams and matrices. Creating such a document is a collaborative process involving various stakeholders, from business analysts to technical architects, and is reviewed by a lead solution architect.
Standards and best practices should be followed consistently, and documentation should be kept up-to-date. This is one of the main reasons why also for solution architects, a mature architecture platform is of such importance. Solution architecture should not be a one-time effort. Embrace a culture of continuous improvement, regularly reviewing and updating architectures.
High-level solution architecture design guidelines
Solution architecture design guidelines are recommendations and best practices that help architects create effective and efficient solutions. These guidelines provide a framework for making design decisions and ensure that the resulting solution aligns with the business goals and objectives.
Solution architecture design guidelines may include a focus on the following:
Understanding the business requirements and objectives
Solution architects should deeply understand the business needs and goals to design a solution that meets those requirements. This involves collaborating with stakeholders, conducting thorough analyses, and documenting the business requirements.
Prioritize scalability and flexibility
Solutions should be designed to accommodate future growth and changes in the business environment. This includes considering data volume, user load, and system integration. Scalability can be achieved through modular design, distributed architecture, and cloud-based infrastructure.
Security
Solutions should be designed with robust security measures to protect sensitive data and prevent unauthorized access. This involves implementing encryption, access controls, and secure communication protocols.
Compliance
Compliance with industry regulations and standards should also be considered.
Maintainability and extensibility
Solutions should be designed in a way that allows for easy maintenance and updates. This includes using modular and reusable components, following coding standards, and documenting the solution architecture.
Performance optimization
Solutions should be designed to deliver optimal performance and responsiveness. This involves considering factors such as response time, resource utilization, and system bottlenecks.
Overall, solution architecture design guidelines provide a framework for creating scalable, secure, maintainable, and performant solutions aligned with business goals. By following these guidelines, solution architects can ensure that their designs meet the organization’s needs and provide long-term value.
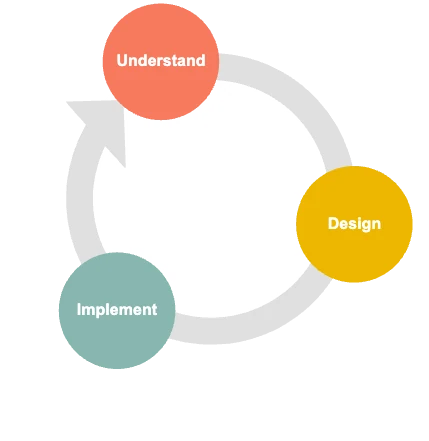
The solution architecture design process
The solution architecture design process is a systematic approach to creating effective and efficient solutions. These solutions should meet the business requirements and align with the organization’s goals and objectives.
It involves a series of steps and activities that guide solution architects in designing the architecture of a software system.
- The first step in the solution architecture design process is to gather and analyze the requirements. This involves understanding the business needs, identifying the stakeholders, and determining the functional and non-functional requirements of the solution. This step helps architects gain a clear understanding of what the solution needs to achieve.
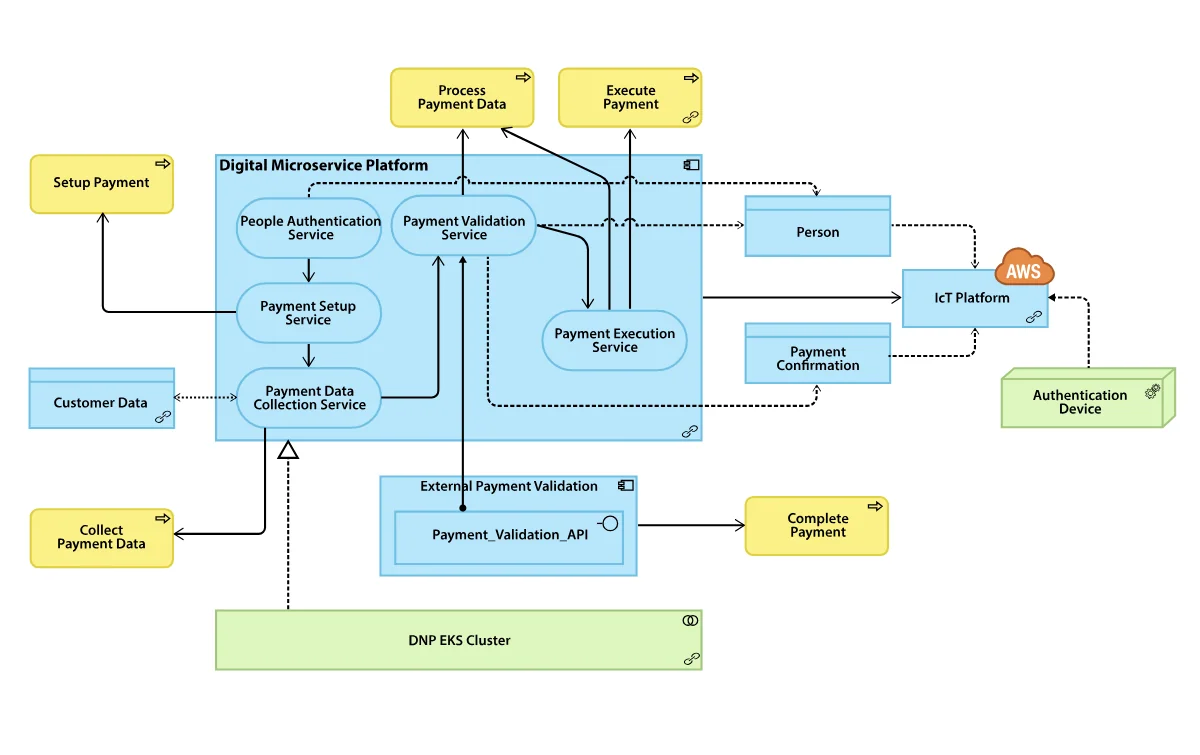
- Once the requirements are gathered, the next step is to create the solution architecture design. This involves defining the overall structure and components of the system, as well as the relationships and interactions between them. You can use various techniques and tools, such as architectural diagrams and models, to visualize and communicate the design.
- After the initial design is created, it is important to validate and refine it. This involves reviewing the design with stakeholders, conducting feasibility studies, and considering factors such as scalability, performance, security, and maintainability. Feedback from stakeholders and subject matter experts is incorporated into the design to ensure its effectiveness.
- Once the design is validated, the next step is to implement the solution. This involves translating the design into actual software components, configuring hardware and infrastructure, and integrating various systems and technologies. You need to work closely with development teams to ensure the design is implemented correctly and meets the intended objectives.
- Throughout the implementation phase, you also need to monitor and evaluate the solution to ensure it functions as expected. You may conduct performance testing, security assessments, and user acceptance testing to identify and address any issues or gaps in the design.
- The solution architecture design process concludes with documentation and knowledge transfer. Architects document the solution’s design decisions, configurations, and specifications to facilitate future maintenance and enhancements. You also share their knowledge and expertise with the development and operations teams to ensure a smooth transition and ongoing solution support.
Different solution architecture design tools
Many solution architecture tools are available for solution architects, like Lucidchart, Diagrams.net, or even freehand drawing tools like Excalidraw. While these are commendable for specific tasks, they often fail to design technical solutions that align with your organization’s business goals.
For a nuanced, in-depth, and efficient design process, solution architects need tools built specifically for the task – tools that cater to the complexities of today’s digital enterprise environment, like an enterprise architecture tool.
RELATED : Enterprise architecture tools
Lucidchart, Excalidraw, and diagram.net are not inherently designed for solution architecture. While these tools are exceptional for crafting diagrams or flowcharts, their primary function isn’t to guide businesses through intricate architectural changes. In contrast, specialized enterprise architecture tools have advanced capabilities and abundant insights and expertise that can mold a solution architect’s vision.
Different solution architecture design tools
Solution architecture design review is a critical process that evaluates the design of a solution. It ensures the design meets the desired objectives, aligns with best practices, and addresses potential risks and issues.
It thoroughly examines the solution architecture, including its components, interfaces, data flows, and integration points.
A solution architecture design review aims to identify any design flaws, gaps, or inconsistencies. Otherwise, this may impact the solution’s performance, scalability, security, or maintainability.
Solution architecture design review process:
- The solution architecture is assessed against established design principles, standards, and patterns during the review. This includes evaluating the adherence to architectural principles such as modularity, scalability, and reusability.
- The review also considers selecting appropriate technologies, frameworks, and tools to suit the solution’s requirements.
- Additionally, the review examines the integration points between different components and systems, ensuring they are well-defined and properly documented. It also assesses the data architecture, ensuring data integrity, consistency, and security.
- The review process involves collaboration between solution architects, technical experts, and key stakeholders. It may include documentation review, code review, and discussions to address any identified issues or concerns.
- Organizations can identify and mitigate potential risks early in development by conducting a thorough solution architecture design review.
- The design review process helps to ensure that the solution is well-designed, robust, and aligned with the business goals, ultimately leading to successful implementation and delivery of the solution.
How to approach the solution architecture review
The ISO/IEC 25010 Quality Model [5] provides a good starting point for the structure of such a review. It can be used to create a structured checklist to assess that the solution is fit for purpose.
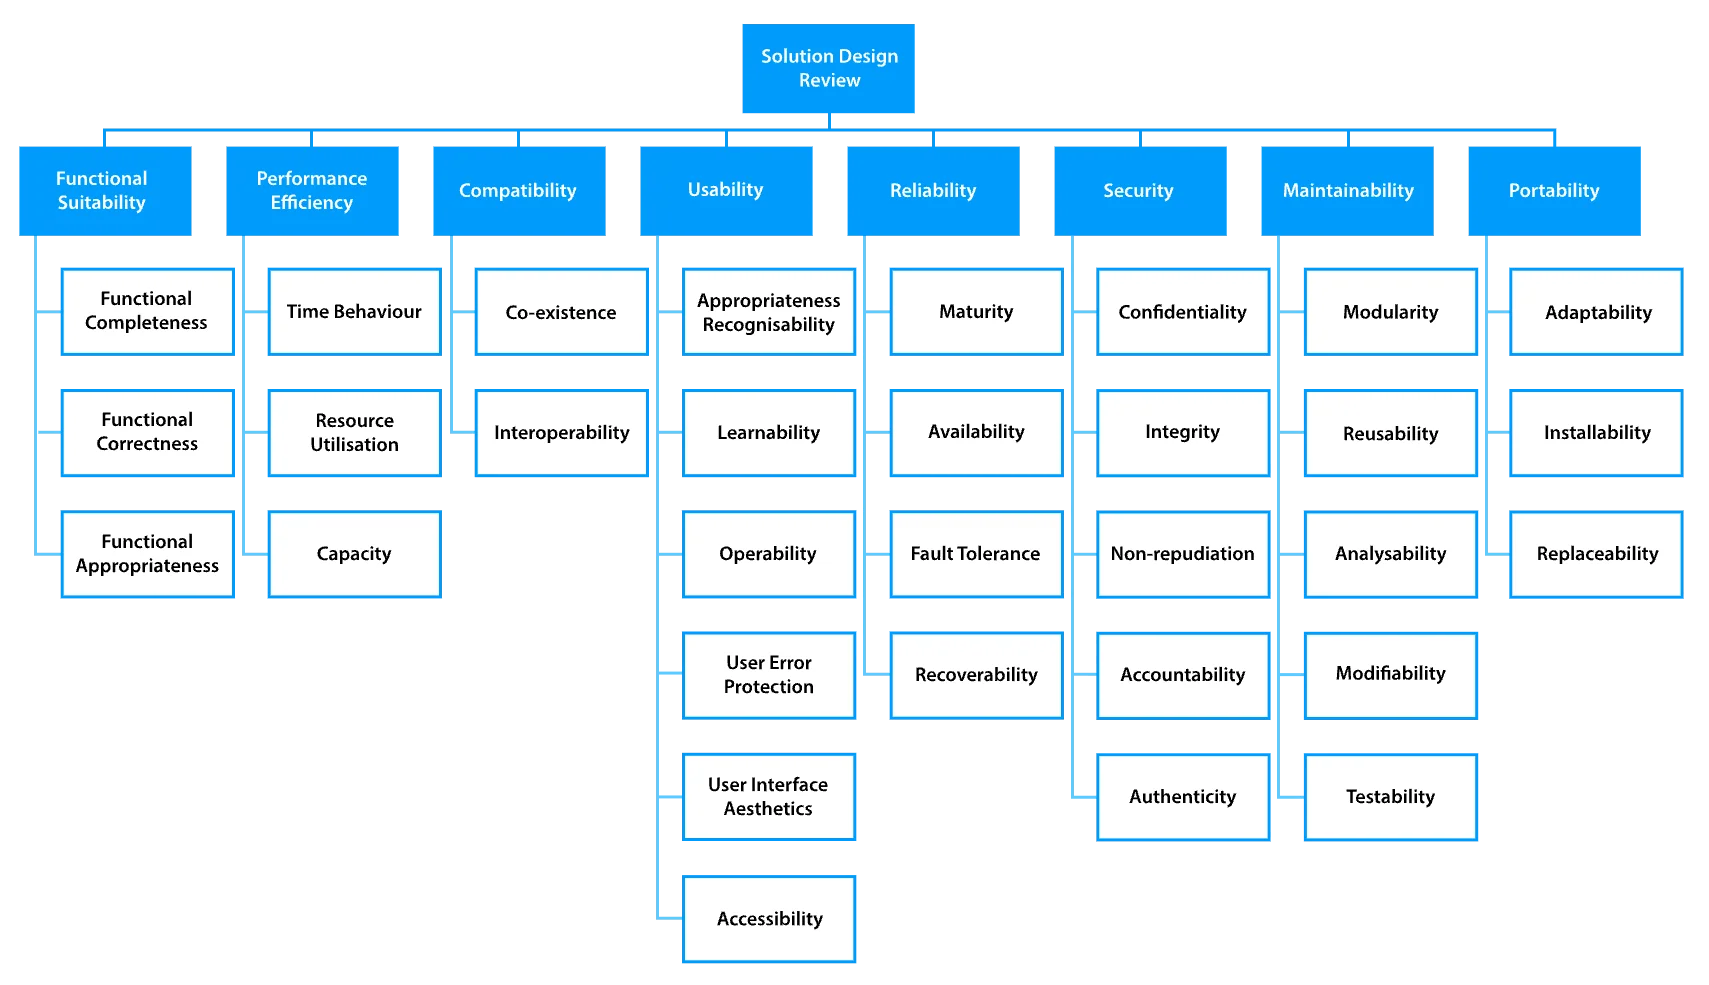
Source [2] The ISO/IEC 25010 Quality Model