ArchiMate® 3.0 and Customer Journey Maps
Sep 19, 2016

A Customer Journey Map is a useful way to graphically represent the customer experience of an organization. It focuses on the touchpoints that characterize the customers’ interaction with the services of the organization and helps you to optimize this experience.
ArchiMate concepts can easily be used in customer journey maps. The backbone of a customer journey map is of course the business process, with the stages therein modeled as sub-processes. The touchpoints with the customer are modeled as business services plus business interfaces, to model both the behavior of the organization and the channels it uses in the customer contact. Different customer journey maps for the same process could be specified for various personas, who are typically modeled as business roles.
Information from customer surveys and other measurements of the customer experience (e.g. data from the website or call center, net promoter score) is added to the steps in the process, using ArchiMate’s profile mechanism to specify relevant attributes. Alternatively, you can define Metric as a specialization of the Driver concept, in the way described in Section 15.2.5 of the ArchiMate 3.0 standard. Different metrics for different aspects of the customer journey can be associated with the steps in the journey. This information has to be evaluated, which can be modeled with the Assessment concept, and appropriate improvements to the customer experience may be specified as Requirements.
There is no fixed, standardized vocabulary in customer journey maps. The table below shows a number of common terms and their mapping onto appropriate ArchiMate concepts
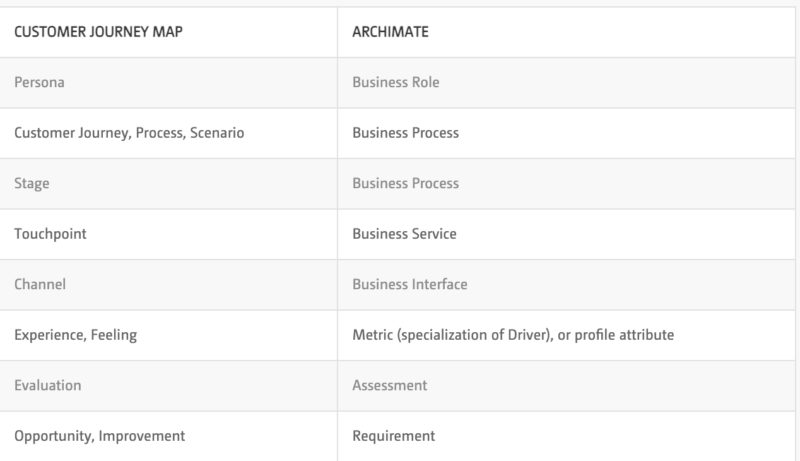
Customer journey maps are typically depicted using a graph that shows the touchpoints in the process on the horizontal axis and the quality of the experience from the customers’ point of view (e.g. in terms of meeting or exceeding their expectations) on the vertical axis. Around this, other kinds of information can be shown in various ways, for example using swimlanes to depict the channels used and smiley faces to show how your customers feel about certain touchpoints, as shown in the figure below.
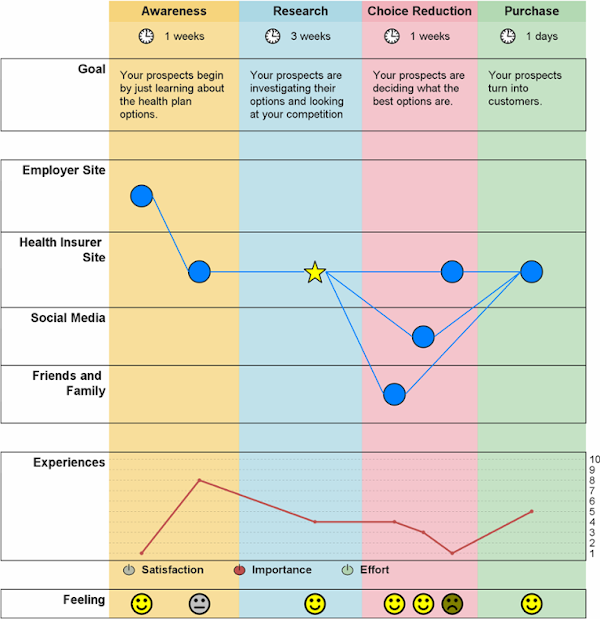
This is of course not expressed in the standard ArchiMate notation, but it is based on an underlying ArchiMate model. Stay tuned for more ArchiMate blog posts!