One of the biggest challenges in making Enterprise Architecture successful is ensuring proper communication with business stakeholders. Enterprise Architecture is quite often perceived as a discipline of the IT organization (where unfortunately also many EA teams are operating), and the traditional EA diagrams are not always the best visualizations for business stakeholders. To create better alignment with the business organization, it is important to create business-friendly visualizations, both from format and content perspective. This will help in improving the maturity of your EA practice and establish it as an enabler of strategic decision making and continuous change.
As with any communication challenge, it all starts with knowing your stakeholders’ concerns. Also, for business stakeholders, identify what kind of people they are, as well as their information needs. The different stakeholder viewpoints that are described in standards like ArchiMate and TOGAF can be a starting point here but will not solve all your communication challenges. However, those viewpoints are often limited to tables, matrices and diagrams, which don’t always resonate with folks on the business side. In this blog post we will present some examples of typical useful business visualizations and dashboards, all created with the help of our platform, HoriZZon.
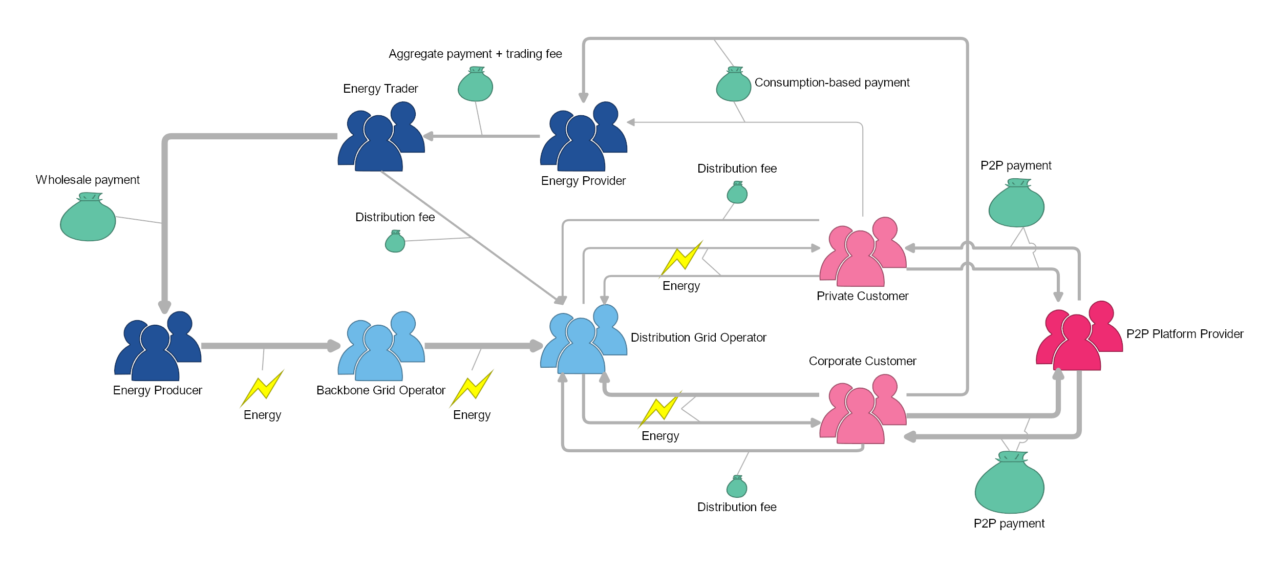
Let’s begin with a business ecosystem view. This can be used to show the position of the organization in its ecosystem, optionally combined with the flow of money and goods that play a role in the ecosystem. In this example we can see the target ecosystem of the Energy market, wereby the P2P Platform Providers will have a new position, as a result of the transitions that are happening now in the Energy market. Importantly, although the symbols look free format, in the backend these are mapped to formal ArchiMate elements in the architecture repository like Business Actor, Value and Material.
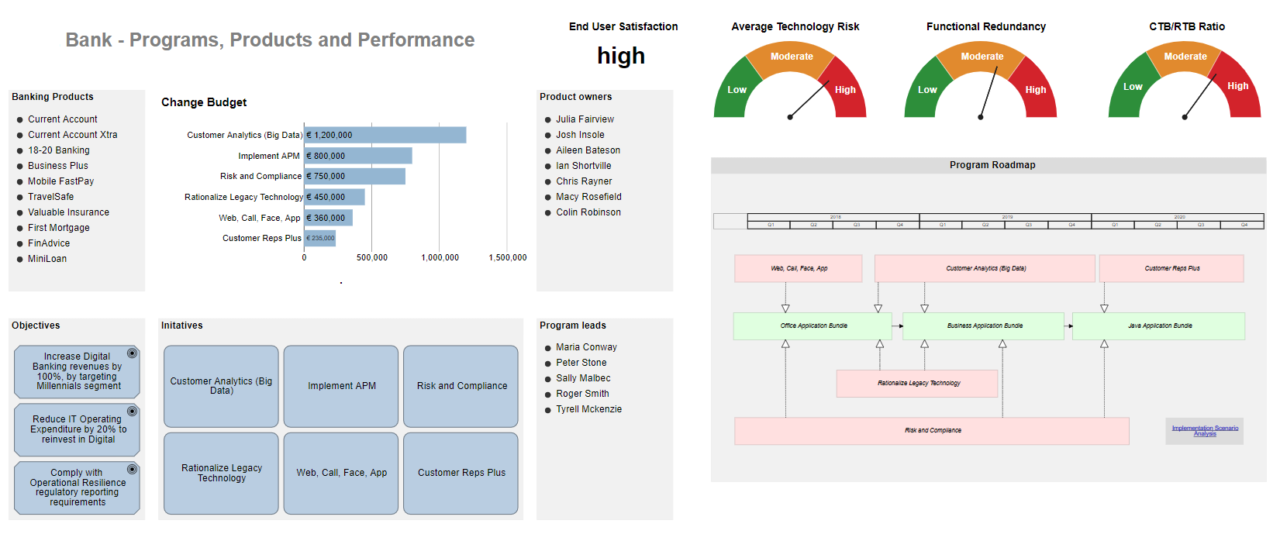
A strategy-on-a-page dashboard is typically used to present a summary of the state of the enterprise and main (planned) initiatives to C-level business stakeholders. In this example of a CIO dashboard, we see top right some performance meters that show the current state of relevant metrics such as risk and functional redundancy. On the left-hand side, key elements of the business (architecture) are shown in terms of products, objectives, product owners, change budget and initiatives. On the right-hand side, below the meters, a roadmap view shows the main initiatives again, but now with a timeline. Such a dashboard can easily be consumed by stakeholders who need to have a high-level insight in the state of the Enterprise. Additionally, and if desired, drill-down to lower level details could be added. In this example, there is a bottom-right button that will open a more detailed implementation scenario analysis view.
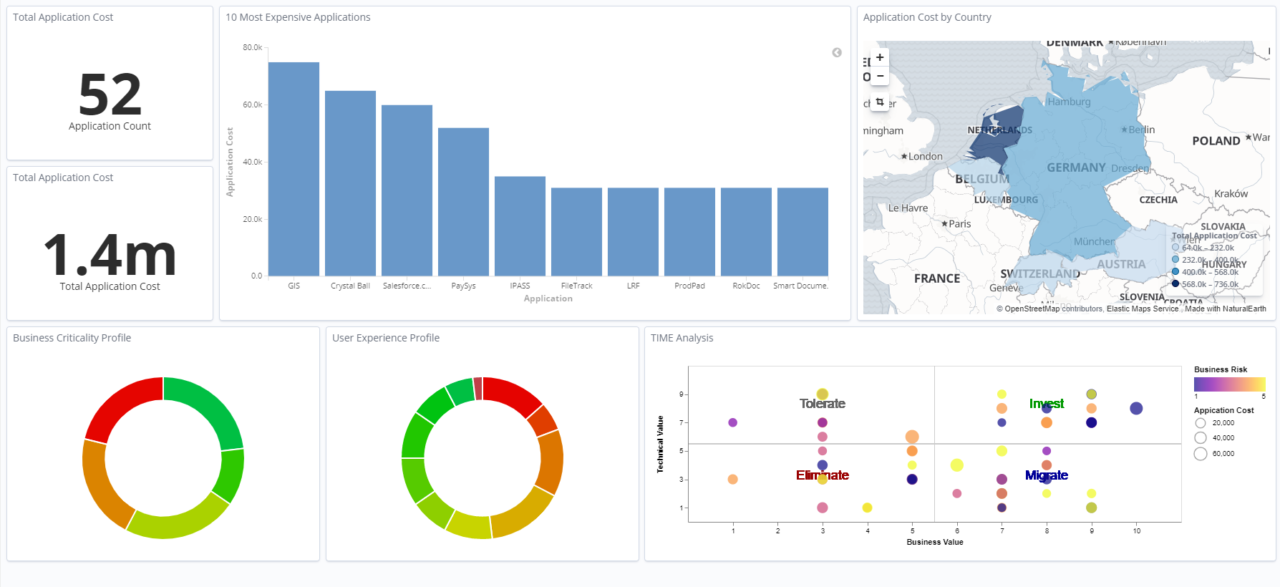
If you want to inform business stakeholders about aspects of the application portfolio that are relevant for them, it is particularly important to think about the communication format. A business-friendly dashboard like the one shown here is often a good approach. This shows in some different charts the main properties of the application portfolio that are relevant for business stakeholders:
Although the content focuses on applications, the metrics that are being shown are often relevant for business stakeholders as well. Alternatively, we could have featured charts that start from business capability perspective and link into the application landscape (for example total costs of applications that are supporting business capability X).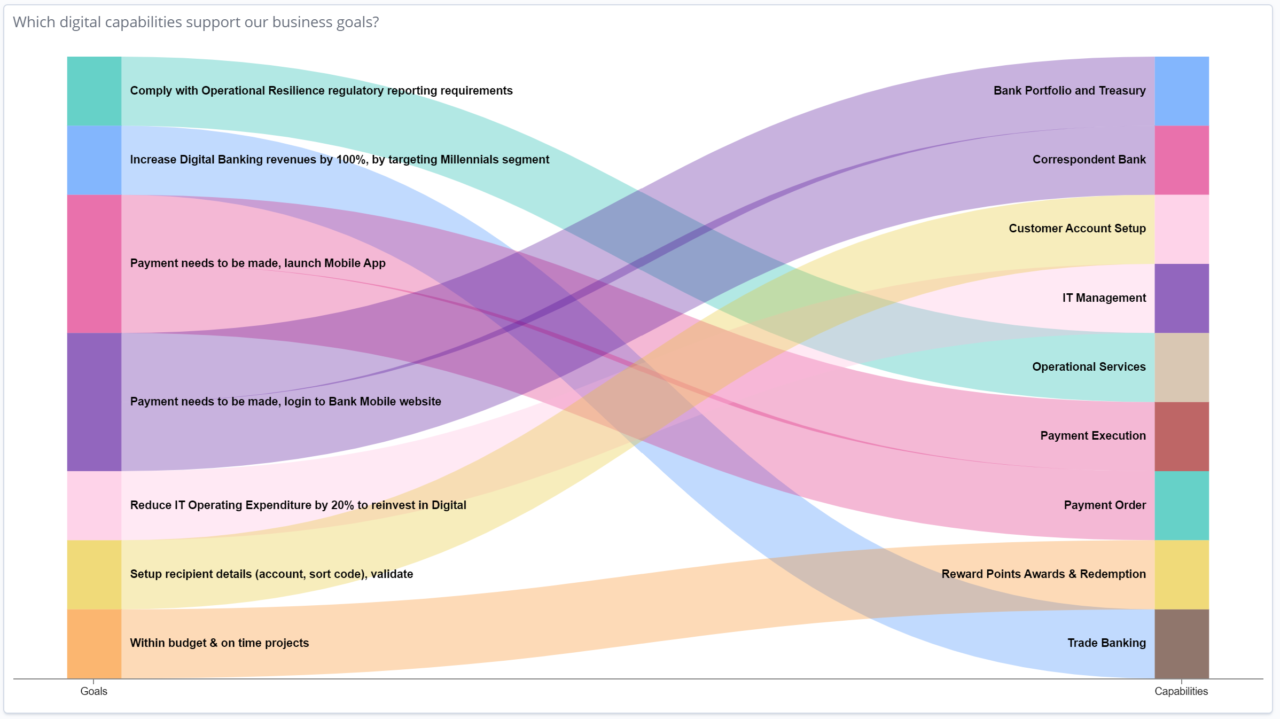
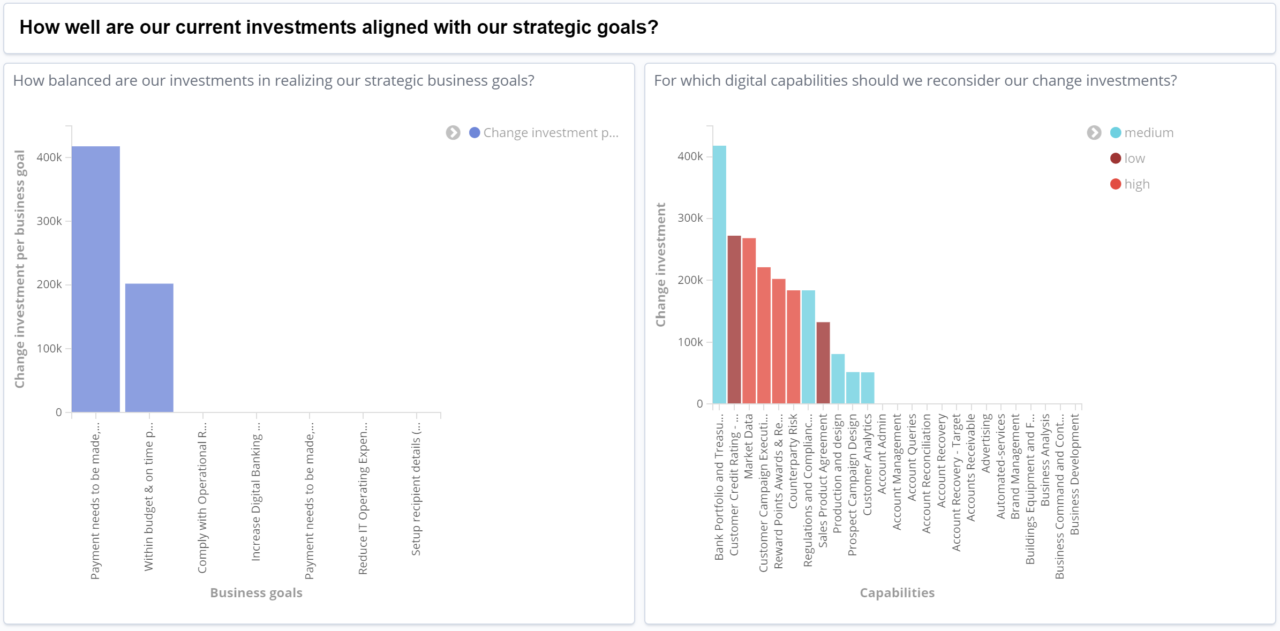
For support in strategic decision making, more advanced dashboards can be useful. In this example we see a snapshot of a dashboard that first shows how various digital capabilities are supporting the company’s business goals. Below that, there are two charts that give insight into the alignment of current investments with the business goals.
The bar chart on the left is showing the change investment levels (in money values, calculated by adding up the total change investment for each business goal from the underlying corresponding business capabilities), making it possible to compare change investment levels between business goals. This chart can be used to re-assess investments to ensure balanced spending itowards relevant business goals.
The bar chart on the right is showing for each business capability the total change investment level (measured in money values). For each bar in the chart, different colors indicate the strategic relevance of the change investments. Capabilities that score relatively high on change investment level but low on strategic relevance need to be re-assessed in terms of their change investment levels.
In summary, there are many more useful deliverables that can be created for business stakeholders apart from the traditional (read IT-focused) EA diagrams. In your communication with business stakeholders, make sure to use these functionalities and your alignment with these stakeholders is sure to improve!
To help you create such communication product, we have created a set of preconfigured “Extended Enterprise Dashboards” that make the most of HoriZZon’s functionality in getting your message across. Stay tuned for a future blog post on these dashboards. And if you want to know more about the features and facilities of our platform, join one of our webinars or get in touch for a personal demo!