


January 31, 2017
8 Steps Enterprise Architects Can Take to Deal with GDPR
- ArchiMate
- BPM Business process management
- Business Architecture
- Business Model Management
- Decision Model Management
- Enterprise Architecture
- Enterprise Architecture Software
- Enterprise Architecture Tools
- Enterprise Portfolio Management
- Governance Risk & Compliance
- Horizzon
- Portfolio Management
- Roadmapping
- Security Architecture


July 14, 2016
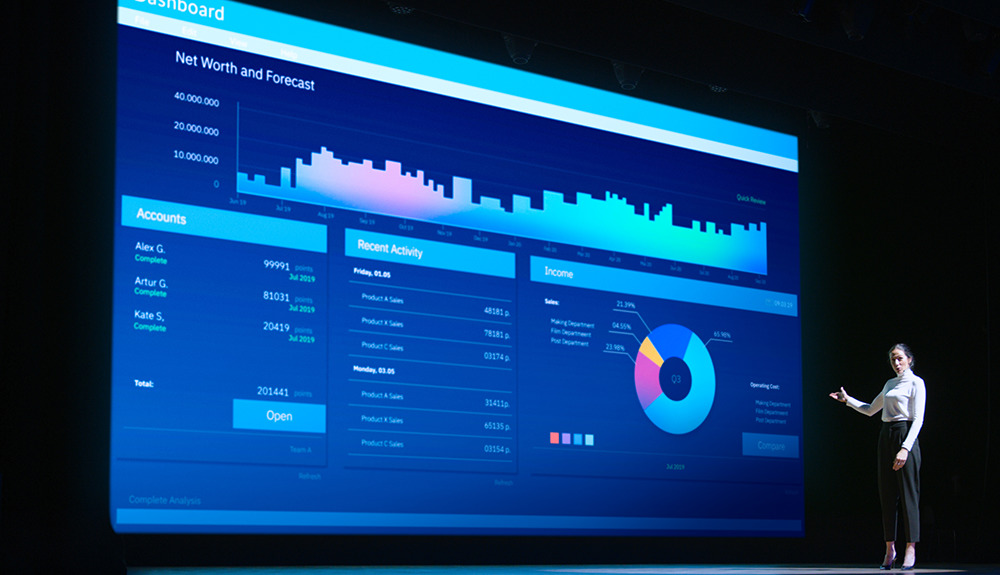
Enterprise Architecture: Key to Successful Business Transformations
- Adaptive Enterprise
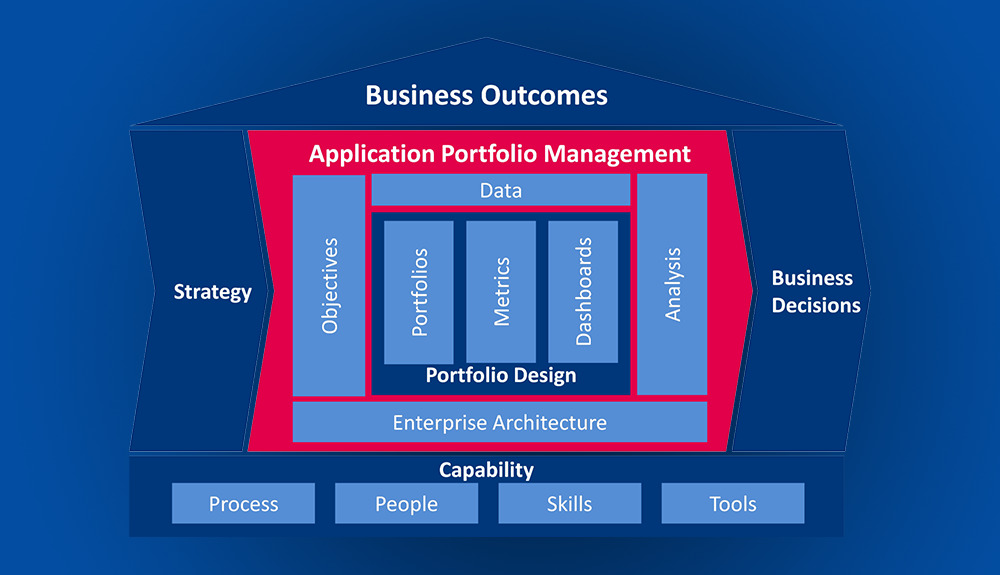
- Application Portfolio Management
- BPM Business process management
- Business Architecture
- Business Capability
- Capability Based Planning
- Digital Transformation
- Enterprise Architecture
- Enterprise Architecture Software
- Enterprise Architecture Tools
- Enterprise Portfolio Management
- Security Architecture

June 14, 2016
ArchiMate® 3.0 – The Next Step in the Evolution of the Standard
- ArchiMate
- Business Architecture
- Business Capability
- Business Model Management
- Business Process Modeling
- Capability Based Planning
- Decision Model Management
- Digital Transformation
- Enterprise Architecture
- Enterprise Architecture Software
- Enterprise Architecture Tools
- Governance Risk & Compliance
- Horizzon
- TOGAF


February 8, 2016
Digital Transformation: How to Manage and Govern a Multi-Speed IT Environment – part I
- BPM Business process management
- Business Architecture
- Business Model Management
- Digital Transformation
- Enterprise Architecture
- Enterprise Architecture Software
- Enterprise Architecture Tools
- Enterprise Portfolio Management
- Governance Risk & Compliance
- Portfolio Management
- Project Portfolio Management


March 3, 2015
Enterprise Portfolio Management: Getting Started
- Application Portfolio Management
- BPM Business process management
- Business Architecture
- Business Model Management
- Decision Model Management
- Enterprise Architecture
- Enterprise Architecture Software
- Enterprise Architecture Tools
- Enterprise Portfolio Management
- Lean Management
- Portfolio Management
- Project Portfolio Management


January 27, 2015
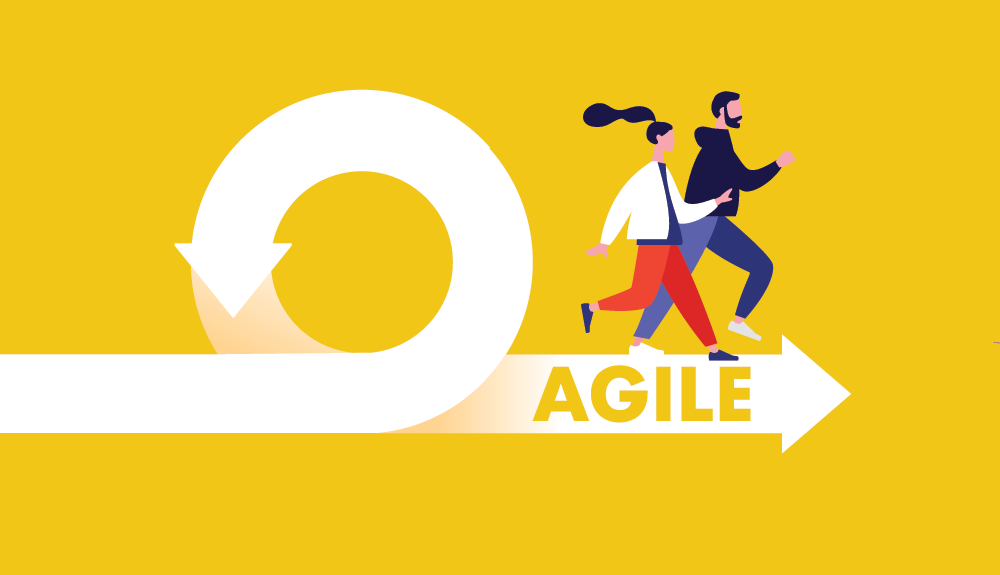
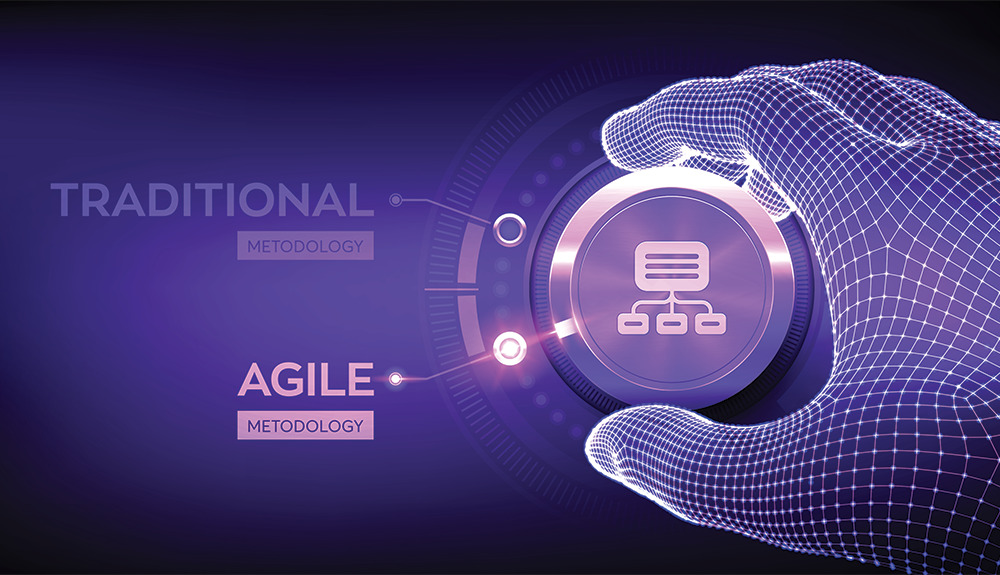
Business Transformation: Dealing with Change in a Lean and Agile Way
- BPM Business process management
- Business Capability
- Business Model Management
- Capability Based Planning
- Decision Model Management
- Digital Transformation
- Enterprise Architecture
- Enterprise Architecture Software
- Enterprise Architecture Tools
- Enterprise Portfolio Management
- Lean Management
- Portfolio Management
- Project Portfolio Management

January 13, 2015
Business Transformation: Coordinating Enterprise Portfolio Management with Other Disciplines
- Application Portfolio Management
- Business Architecture
- Business Capability
- Business Model Management
- Capability Based Planning
- Enterprise Architecture
- Enterprise Architecture Software
- Enterprise Architecture Tools
- Enterprise Portfolio Management
- Governance Risk & Compliance
- Lean Management
- Portfolio Management
- Project Portfolio Management


December 14, 2014
Escaping the Jaws of the Project Monster
- Application Portfolio Management
- Business Architecture
- Business Capability
- Capability Based Planning
- Digital Transformation
- Enterprise Architecture
- Enterprise Architecture Software
- Enterprise Architecture Tools
- Enterprise Portfolio Management
- Governance Risk & Compliance
- Lean Management
- Portfolio Management
- Project Portfolio Management


November 21, 2014
Enterprise Architecture: Need for Speed
- BPM Business process management
- Business Architecture
- Business Capability
- Business Model Management
- Decision Model Management
- Enterprise Architecture
- Enterprise Architecture Software
- Enterprise Architecture Tools
- Enterprise Portfolio Management
- Lean Management
- Portfolio Management
- Project Portfolio Management

November 11, 2014
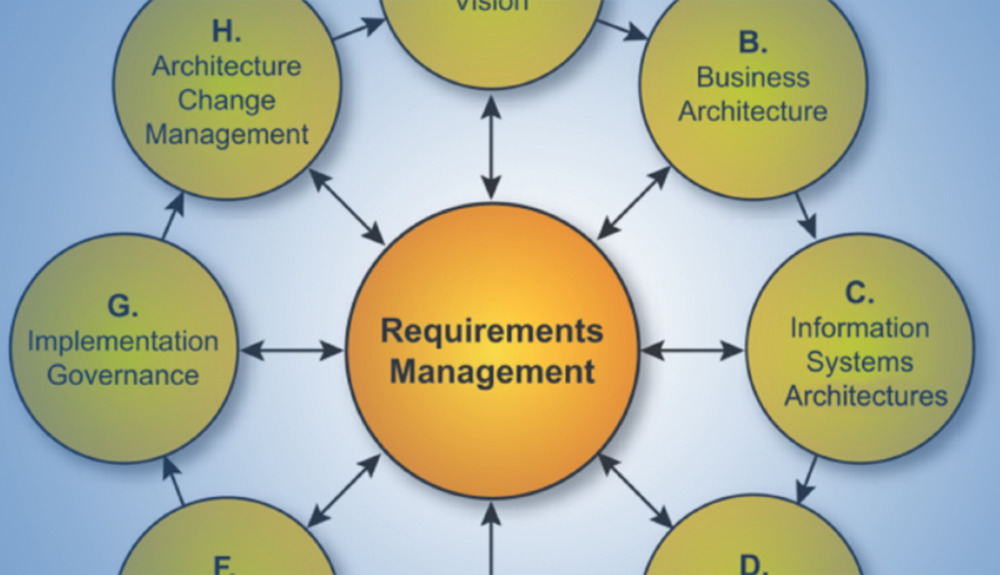
Rapidly Delivering Business Value with TOGAF
- ArchiMate
- BPM Business process management
- Business Architecture
- Business Model Management
- Business Process Modeling
- Decision Model Management
- Enterprise Architecture
- Enterprise Architecture Software
- Enterprise Architecture Tools
- Enterprise Portfolio Management
- Governance Risk & Compliance
- Portfolio Management
- Project Portfolio Management
- TOGAF

October 10, 2014
Driving Business Outcomes with Enterprise Architecture as a Knowledge Hub
- BPM Business process management
- Business Architecture
- Business Capability
- Business Model Management
- Capability Based Planning
- Decision Model Management
- Enterprise Architecture
- Enterprise Architecture Software
- Enterprise Architecture Tools
- Governance Risk & Compliance
- Horizzon
- Portfolio Management
- Roadmapping