Combining Structure and Data: Business Intelligence 2.0
Nov 15, 2018

In previous blog posts, we have written about various analysis techniques that help you get more value from your models, as well as dashboarding techniques to visualize data in all kinds of ways. These two topics point to a more general theme: the new possibilities you get from enriching your models with various types of external data. We call this Business Intelligence 2.0.
In “traditional” BI, you analyze data to uncover hidden patterns and trends in often unstructured data. This is applied in all sorts of ways, from assessing customer behavior for advertisement targeting to monitoring and analyzing equipment for predictive maintenance purposes. This may concern large and real-time data streams, captured in the typical V’s of big data: volume, velocity, and variety. Nowadays, the term “big data” isn’t as popular anymore as it was a few years ago, perhaps because its “bigness” is not that special anymore. Nevertheless, data analysis and business intelligence have become major drivers for digital transformation of the enterprise, leading to increasingly data-driven business models and companies.
In contrast to BI, “traditional” enterprise architecture and business process modeling are based on capturing knowledge about the enterprise in an a priori structured way. This allows us to analyze and change the organization, its processes, IT systems and other assets in a planned manner. EA helps make sure all the bits fit together and takes care of various requirements and constraints, from regulatory compliance and cost efficiency to customer satisfaction and digital innovation.
So, these two approaches provide different ways of capturing knowledge:
Now these two approaches are not mutually exclusive. Even better, they can fruitfully complement each other, offering knowledge you cannot find any other way.
You can augment your architecture models with operational (possibly real-time) data on the performance of your IT applications and infrastructure. This lets you analyze and predict the impact of operational issues on business capabilities and outcomes. The heatmap below shows the result of such an analysis: calculating the availability of different business capabilities based on the availability of all the IT systems that support them. Say that all your IT applications have an availability of 99%. If a business capability relies on 30 applications to be up and running at the same time because they all depend on each other, the resulting availability of that capability is just 75%.

Such an analysis may help you to define business-oriented KPIs instead of (or next to) simple IT metrics (like uptime). Furthermore, it may lead you to a focused initiative to decomplicate your application landscape, reducing dependencies on applications that cause these business-level disruptions.
This is just one example where the combination of structural information from your models with operational data from e.g. monitoring creates insights you could not have gained another way.
A different approach is to use monitoring data to find structure. Process mining, also known as automated business process discovery, is an example of this. By using e.g. event logs, audit trails of systems, or business activity monitoring (BAM), you can find out what the actual business process is that is executed. You can use this to discover that process if no a priori model is available, or for conformance checking, when you do have such a model. BiZZdesign’s sister company MonkeyMining is one of the companies that offer solutions in this space.
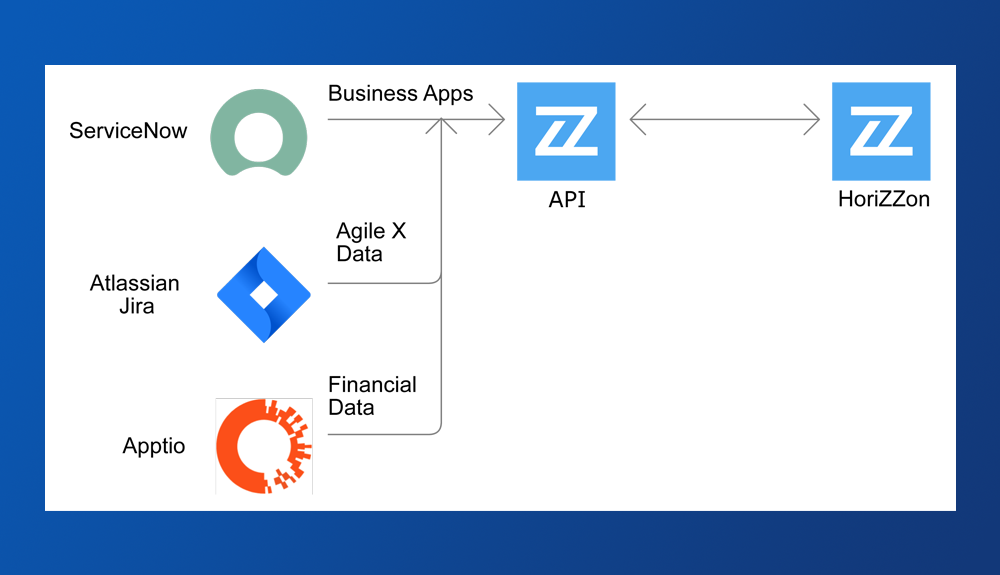
The notion of “mining” for knowledge also applies to the broader architecture domain. You might, for example, use similar techniques to uncover your infrastructure landscape. IT service management tools like ServiceNow (with which we have a native API connection) can listen to your network and discover your IT resources automatically. Up to a point that is, since they will not be able to find the higher levels of your architecture – finding abstractions like business capabilities requires human intelligence.
Both these examples show that the combination of structure and data offers unique advantages. BiZZdesign’s product suite is ideally suited to support this. Enterprise Studio is the class-leading modeling environment in which you can set up the structural part of your analyses, with models in standards like ArchiMate, BPMN, UML and others, and an extremely powerful built-in querying and scripting language to build custom analyses. Our Horizzon platform offers advanced capabilities for data streaming and BI dashboarding and decision support. Together, these are the foundation for BI 2.0.
And you can go even beyond this. In a future blog post, we will address how this combination of structure and data enables what Gartner calls the “Digital Twin Organization”: using enterprise models that create a real-time mirror image of your organization and its operations, allowing you to control and direct your enterprise instantaneously. Stay tuned!